Project Overview
LI Duck's Data-Tracking Baseball
UX/UI Blended Experience Case Study | Class Project
September 2022 - November 2022
UX/UI Blended Experience Case Study | Class Project
September 2022 - November 2022
Problem: Kids can be the biggest reason why families don't go to games.
Key Objective: Utilize conducted research to create a case study on blending experiences through a product demonstrated with a storyboard and prototype that aims to solve a real-world problem in the sports and entertainment domain, specifically, for the LI Ducks.
Solution: A Data-tracking baseball for kids.
Significant Outcomes: My case study served as an illustrative example for upcoming students in the course and for my professor's future presentations on designing blended experiences.
Tools: Figma, Adobe Photoshop, and Keynote
Location: Farmingdale State College
What Is Designing Blended Experiences?
Mix of the physical and digital space
Blended experiences involve the integration of physical and digital spaces in the use of a product. In this case study, I learned to create a product that gives experiences for users through physical, digital, and blended spaces. For further information, please contact Brian O'Keefe at okeefeb@farmingdale.edu.
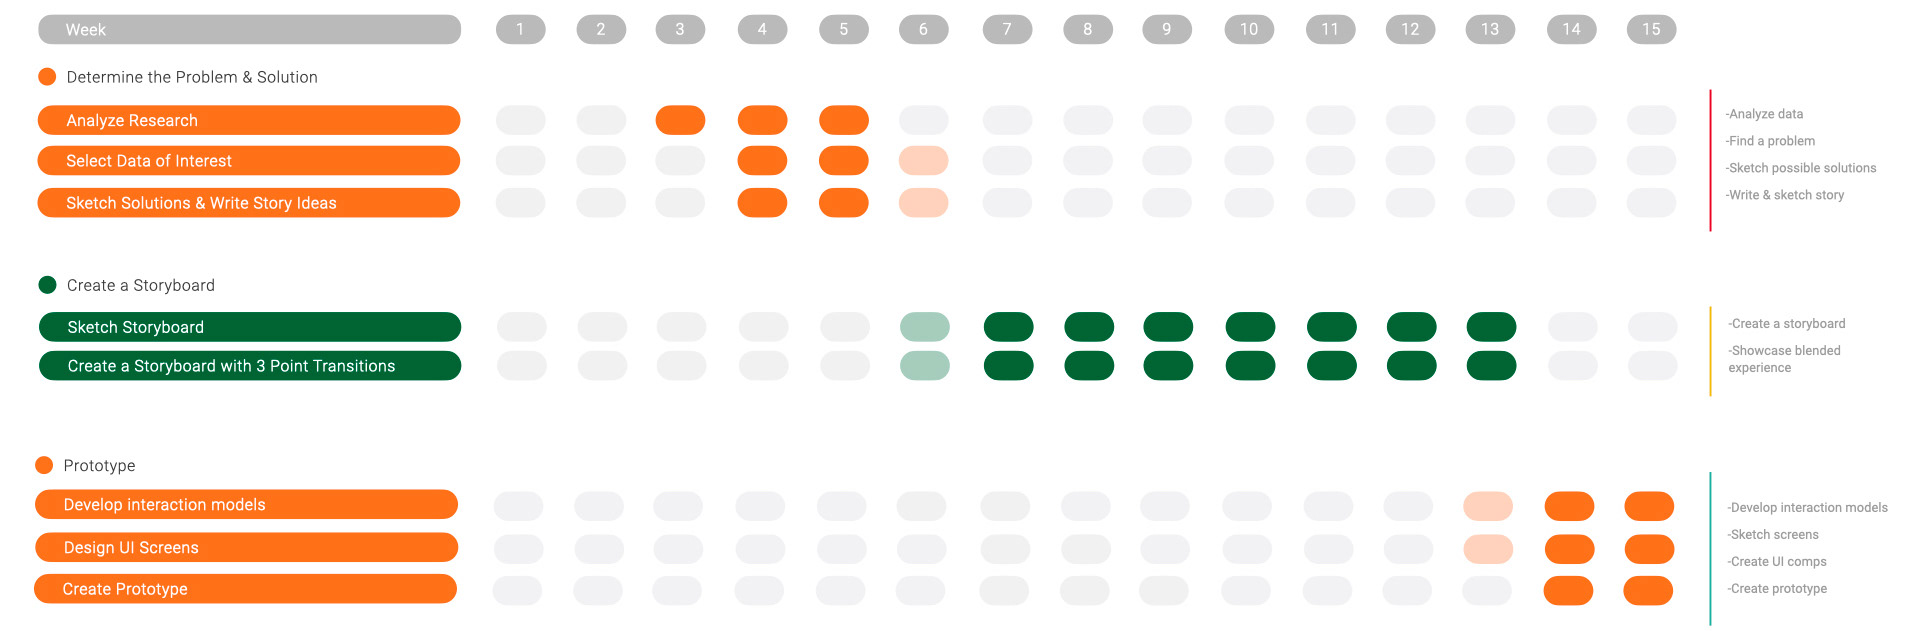
Design Process
15 Weeks

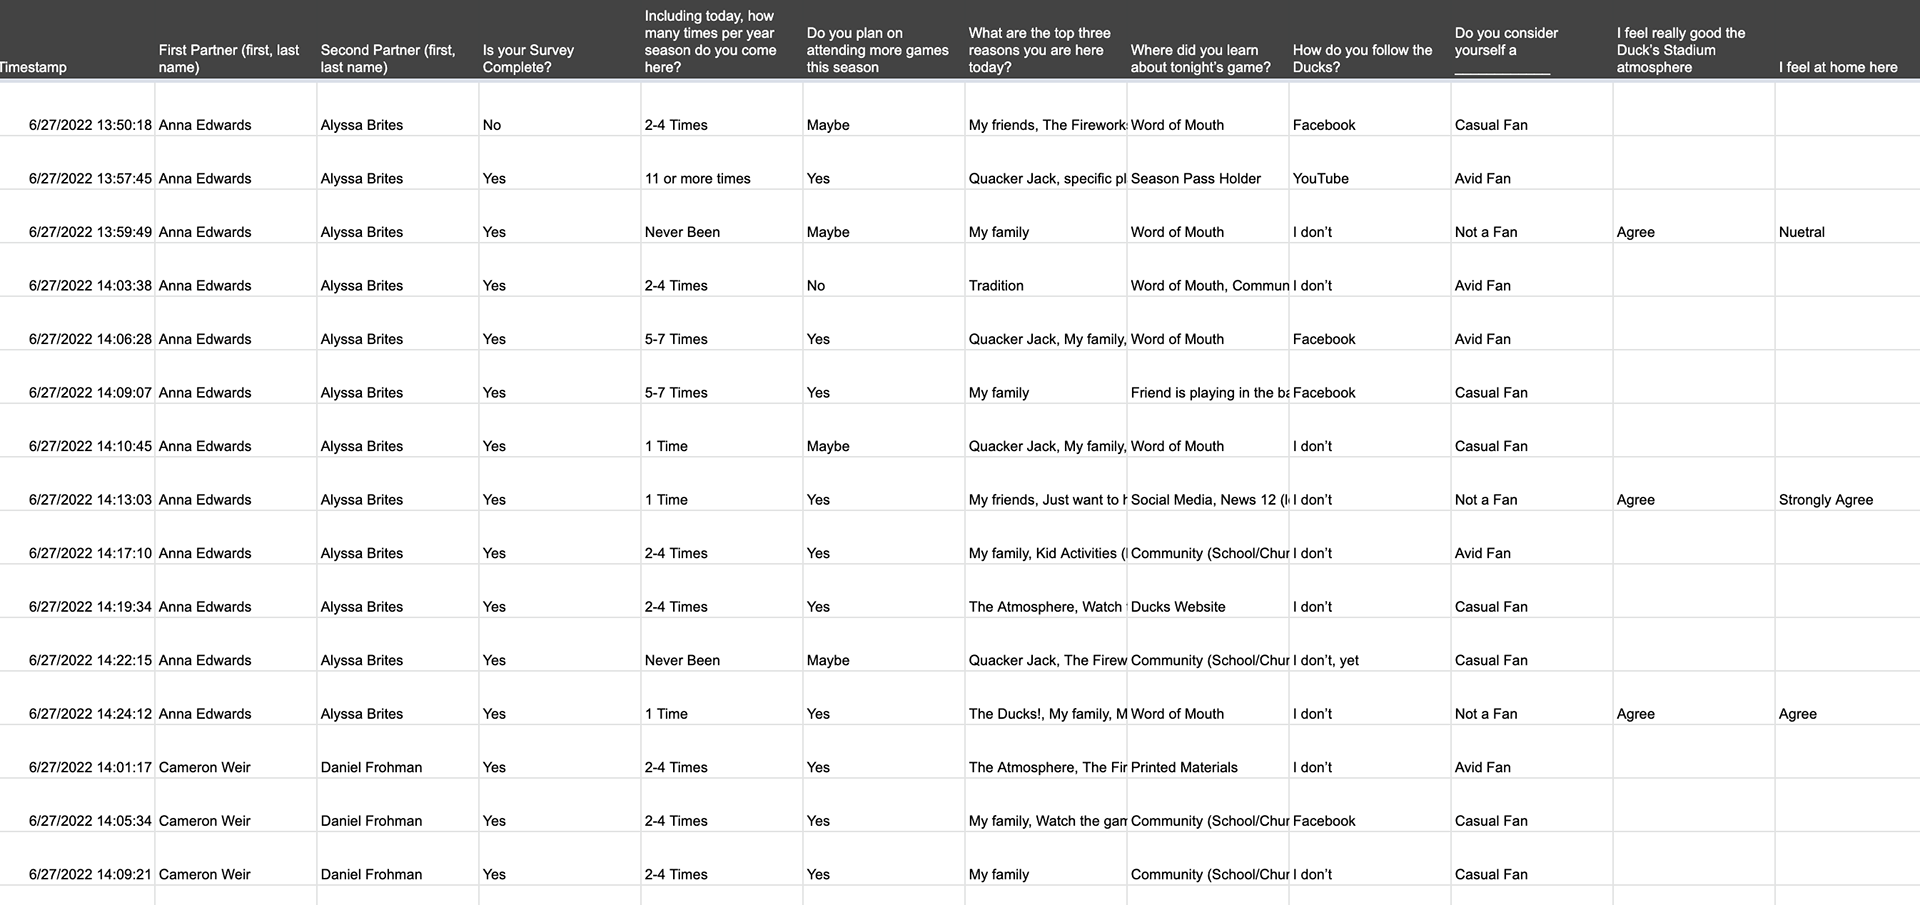
Conducting Summer Research
Individuals who come to LI Ducks' baseball games
Through the Summer of 2022, visitor students from the Edinburgh Napier University, UK, collaborated with students within Farmingdale State College's IXD Program (USA), to complete research at Fairfield Properties Ballpark, home of the Long Island Ducks. The purpose of the research was to determine the behaviors, experiences, motivations, and frustrations of individuals who come watch baseball games.
Discovering the Problem
Kids can be the biggest reason why families don't go to games
After analyzing the data collected from visitor surveys, I have found that many visitors' experiences were often based on their kid’s behavior. Based on the question, “What would stop you from coming back to a Ducks Game?”, many responses claimed that if their kids did not like going to the game, that would stop them from coming back. Other responses suggested keeping kids in control and providing kids with activities so they do not get bored.
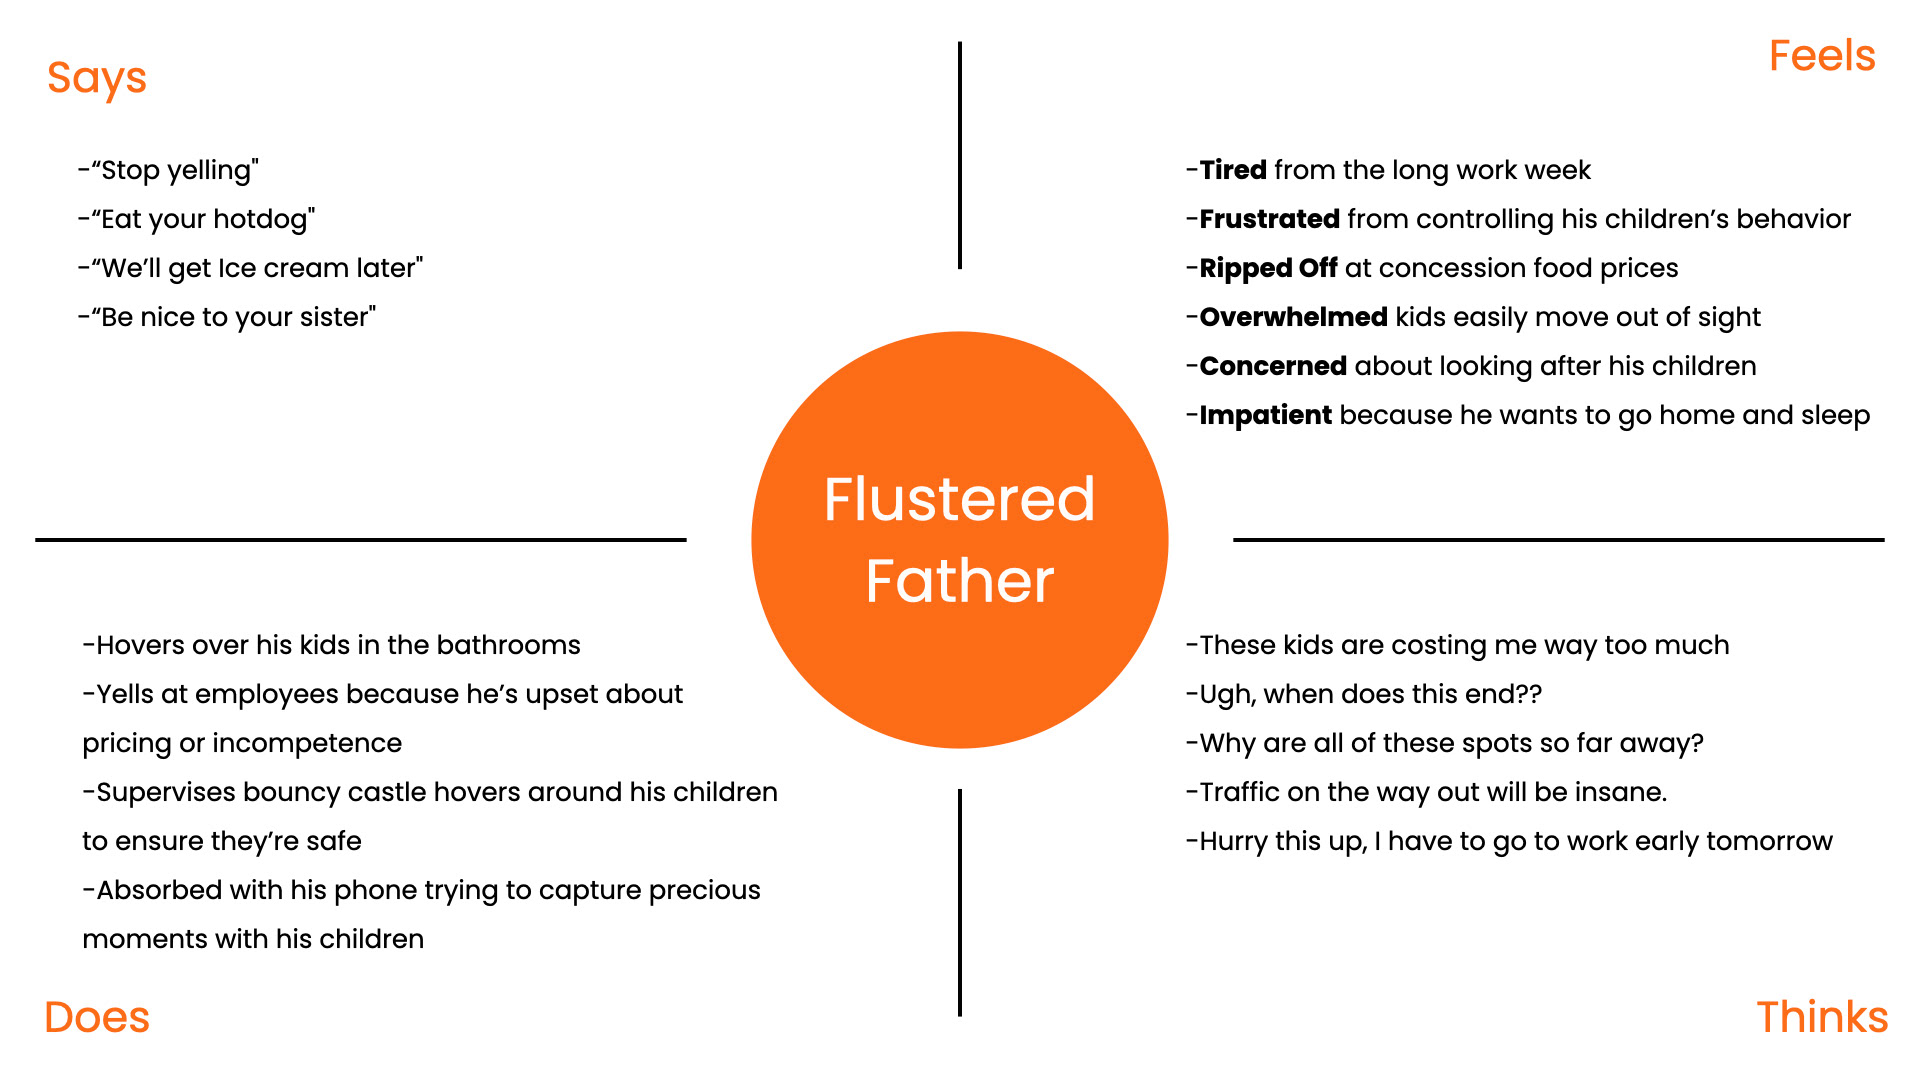
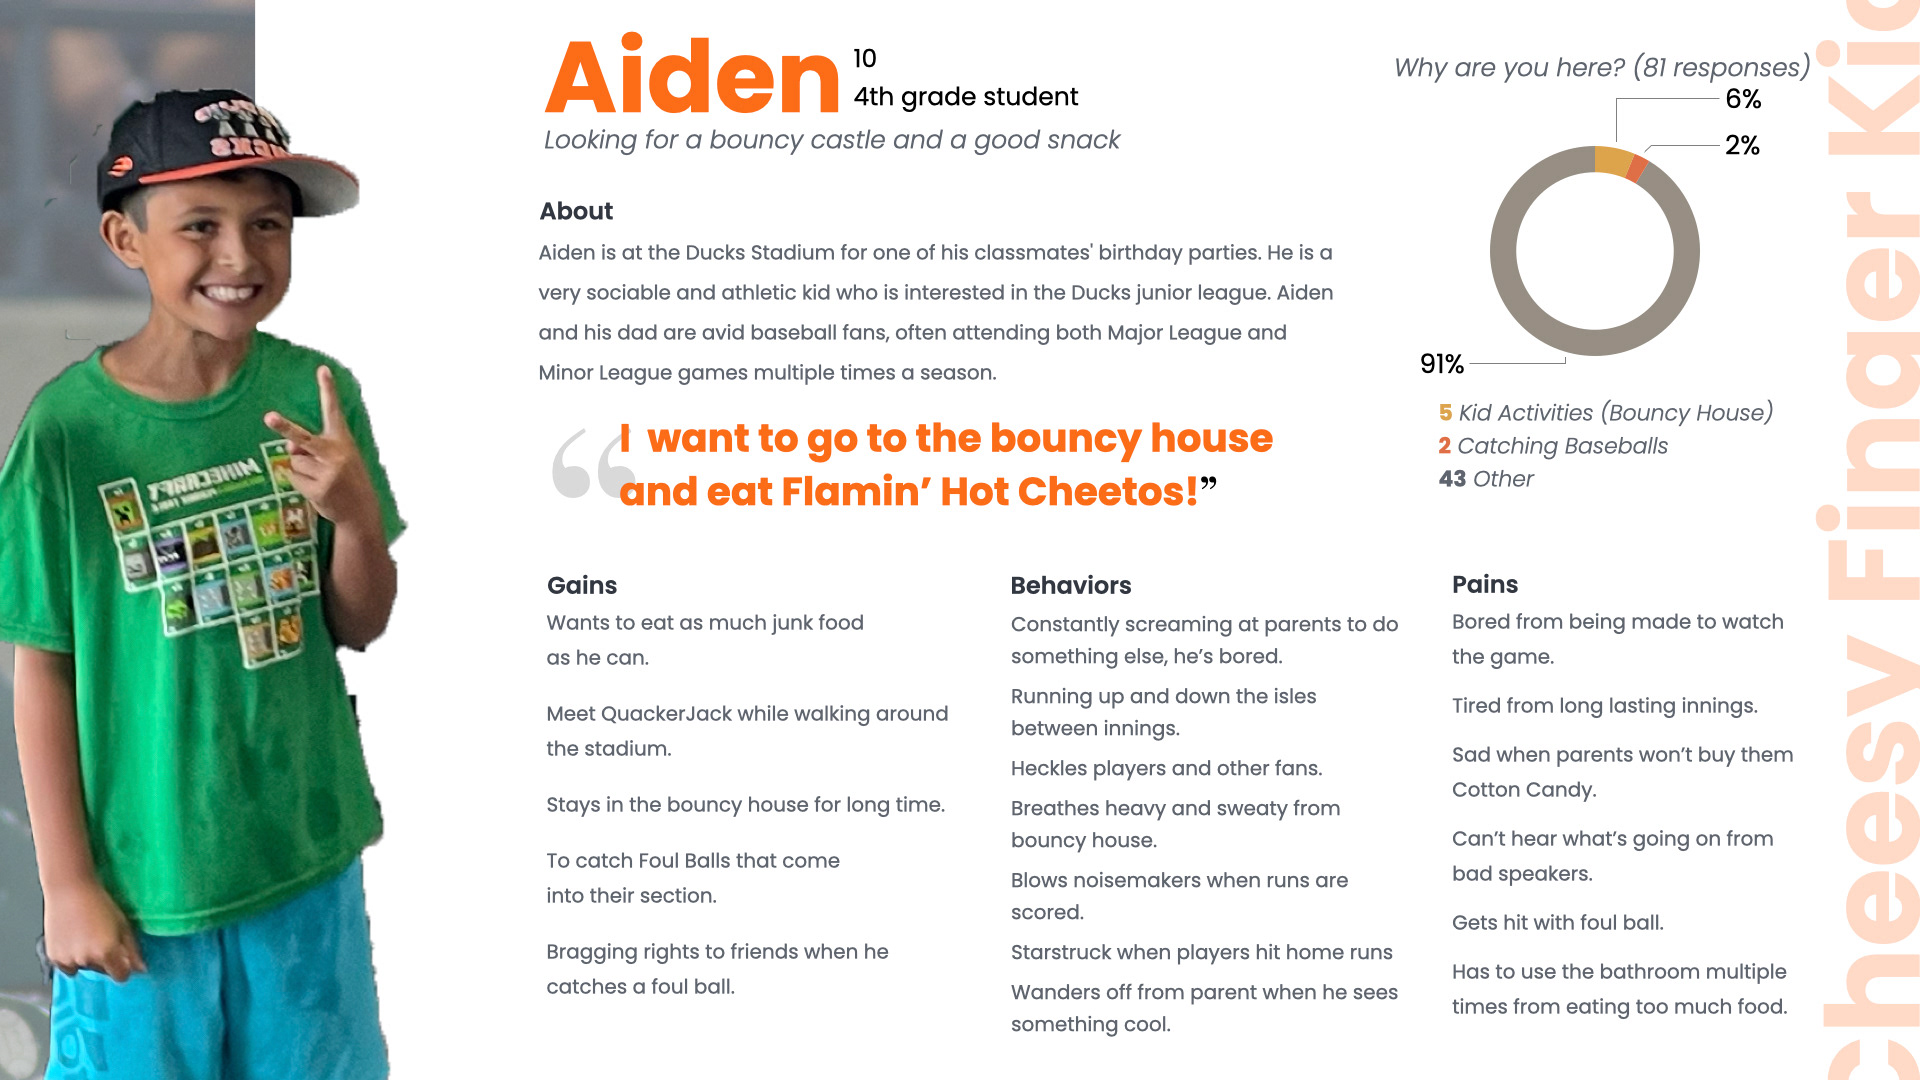
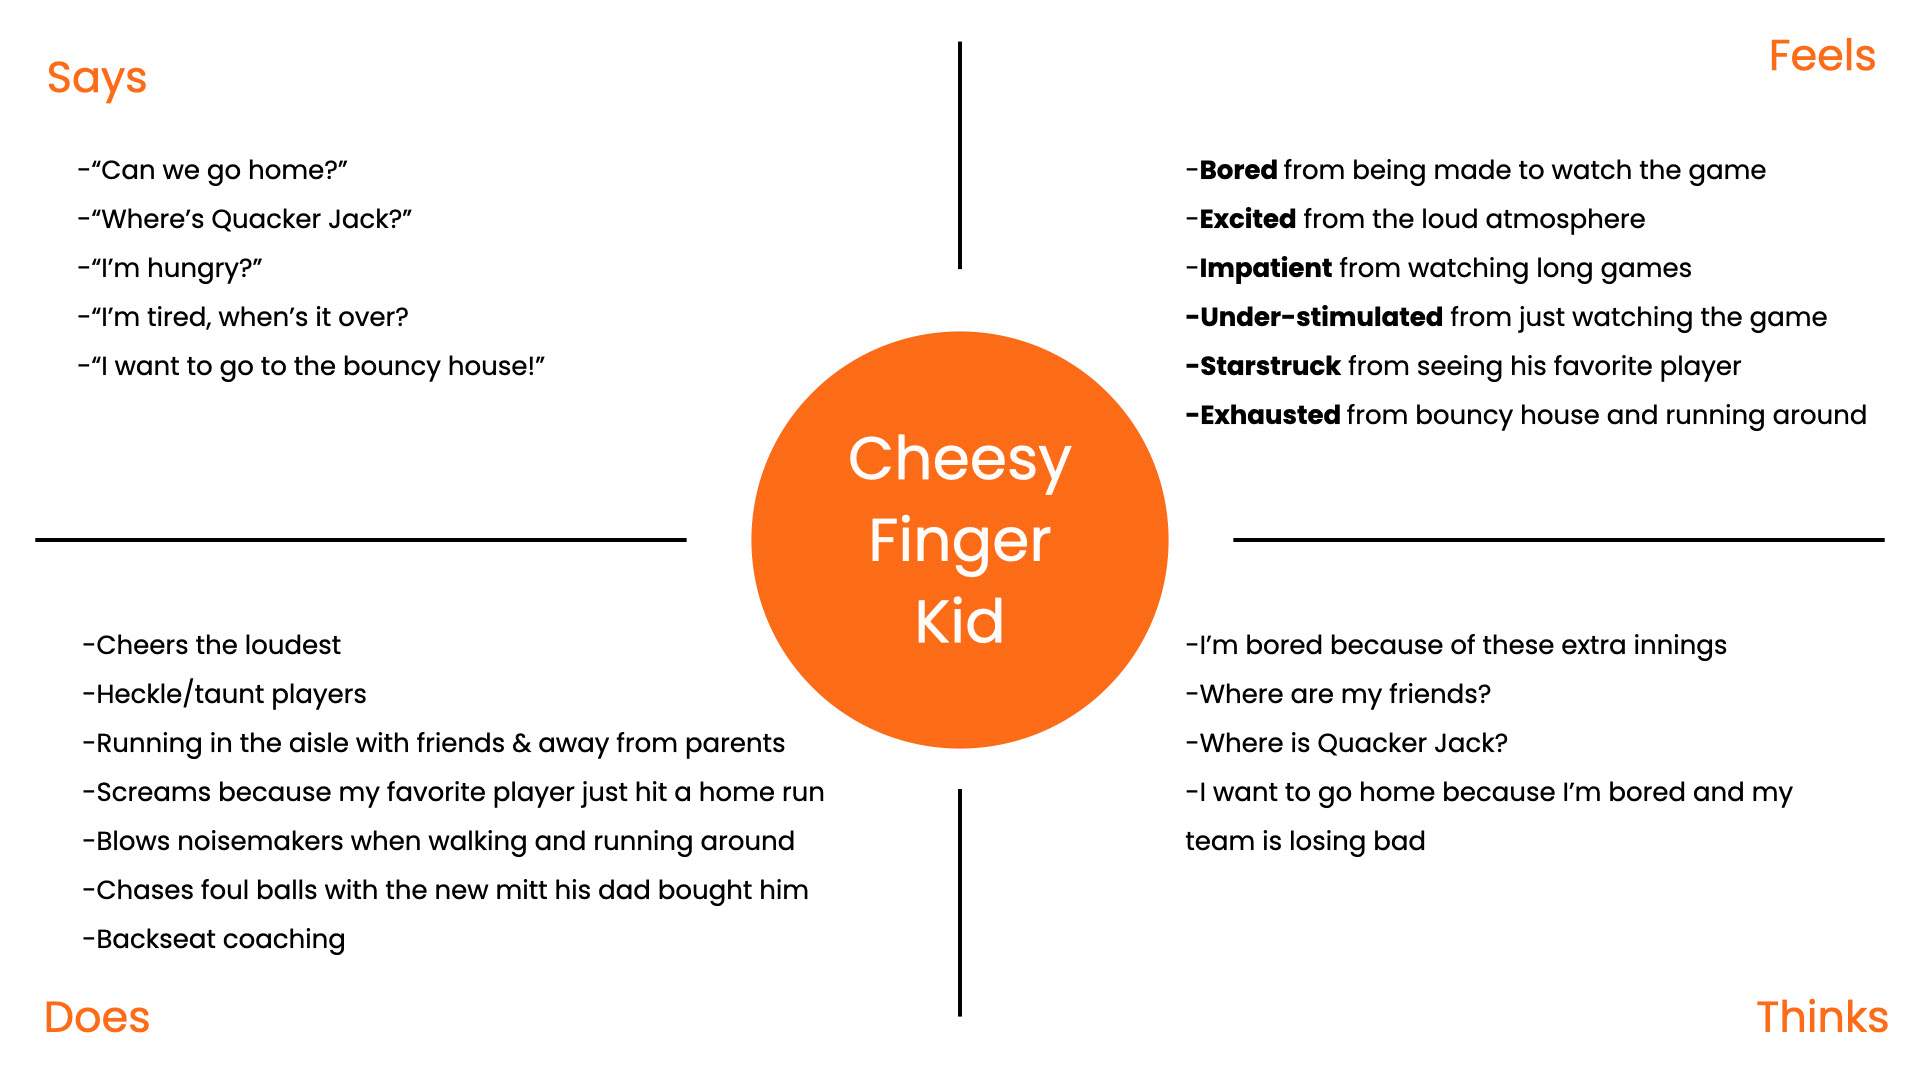
Personas and Empathy Maps
Meet Jerry and Aiden
Referring to the personas developed during the summer research, I was able to gain a deeper understanding of the parents and children attending the games. Among them, we have Jerry, a single father of two seeking quality time with his energetic kids but finding it challenging to manage them. Additionally, there's Aiden, a highly energetic fourth-grader, often running and playing with his friends.

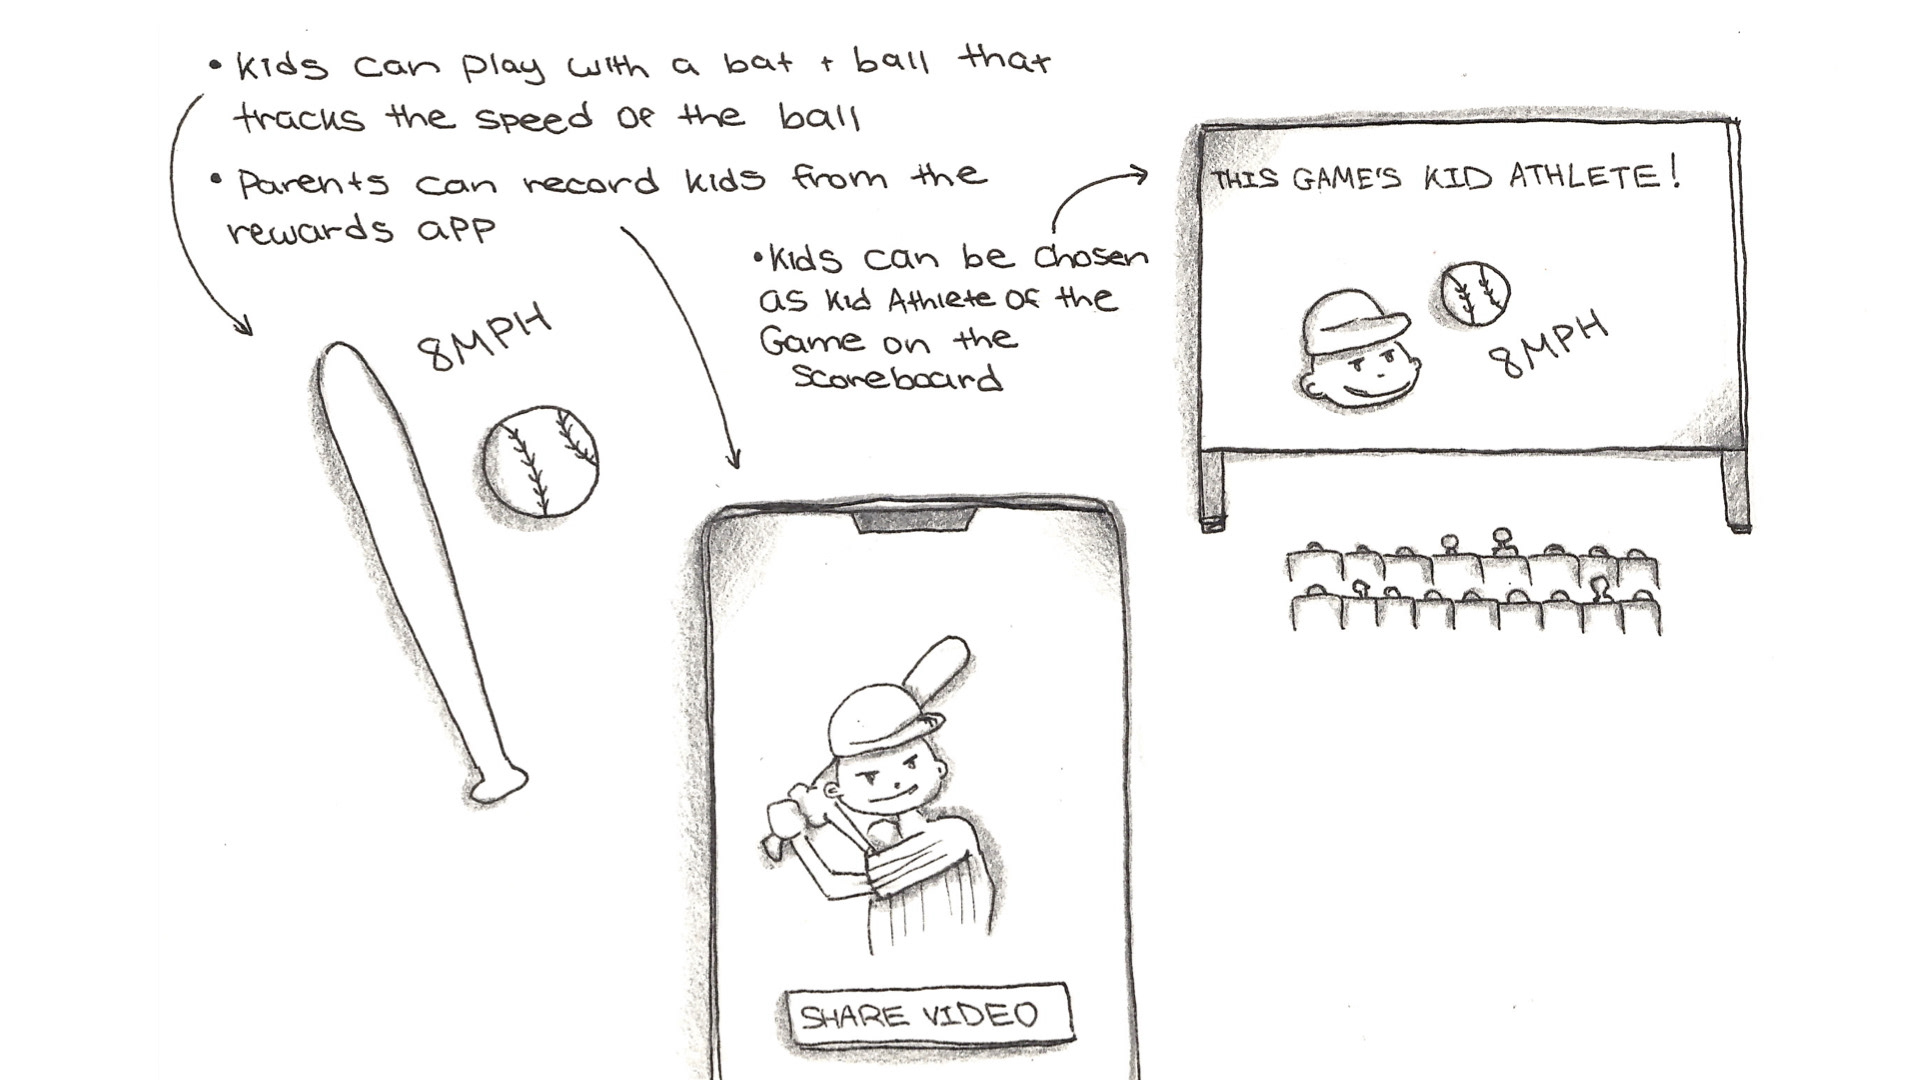
Developing a Solution
A Data-Tracking Baseball For Kids
Based on the discovery of the problem, I decided to sketch different solution. The primary personas I was primarily designing for were parents and their kids so they can spend family time together. In this sketch, the LI Ducks Data-Tracking Baseball is design for kids by creating a fun, exciting, and engaging experience so that families would be more encouraged to come to the LI Ducks games. The product can encourage kids to come to the games through excitement and engagement.
Other Possible Solutions
What about an interactive seat screen?
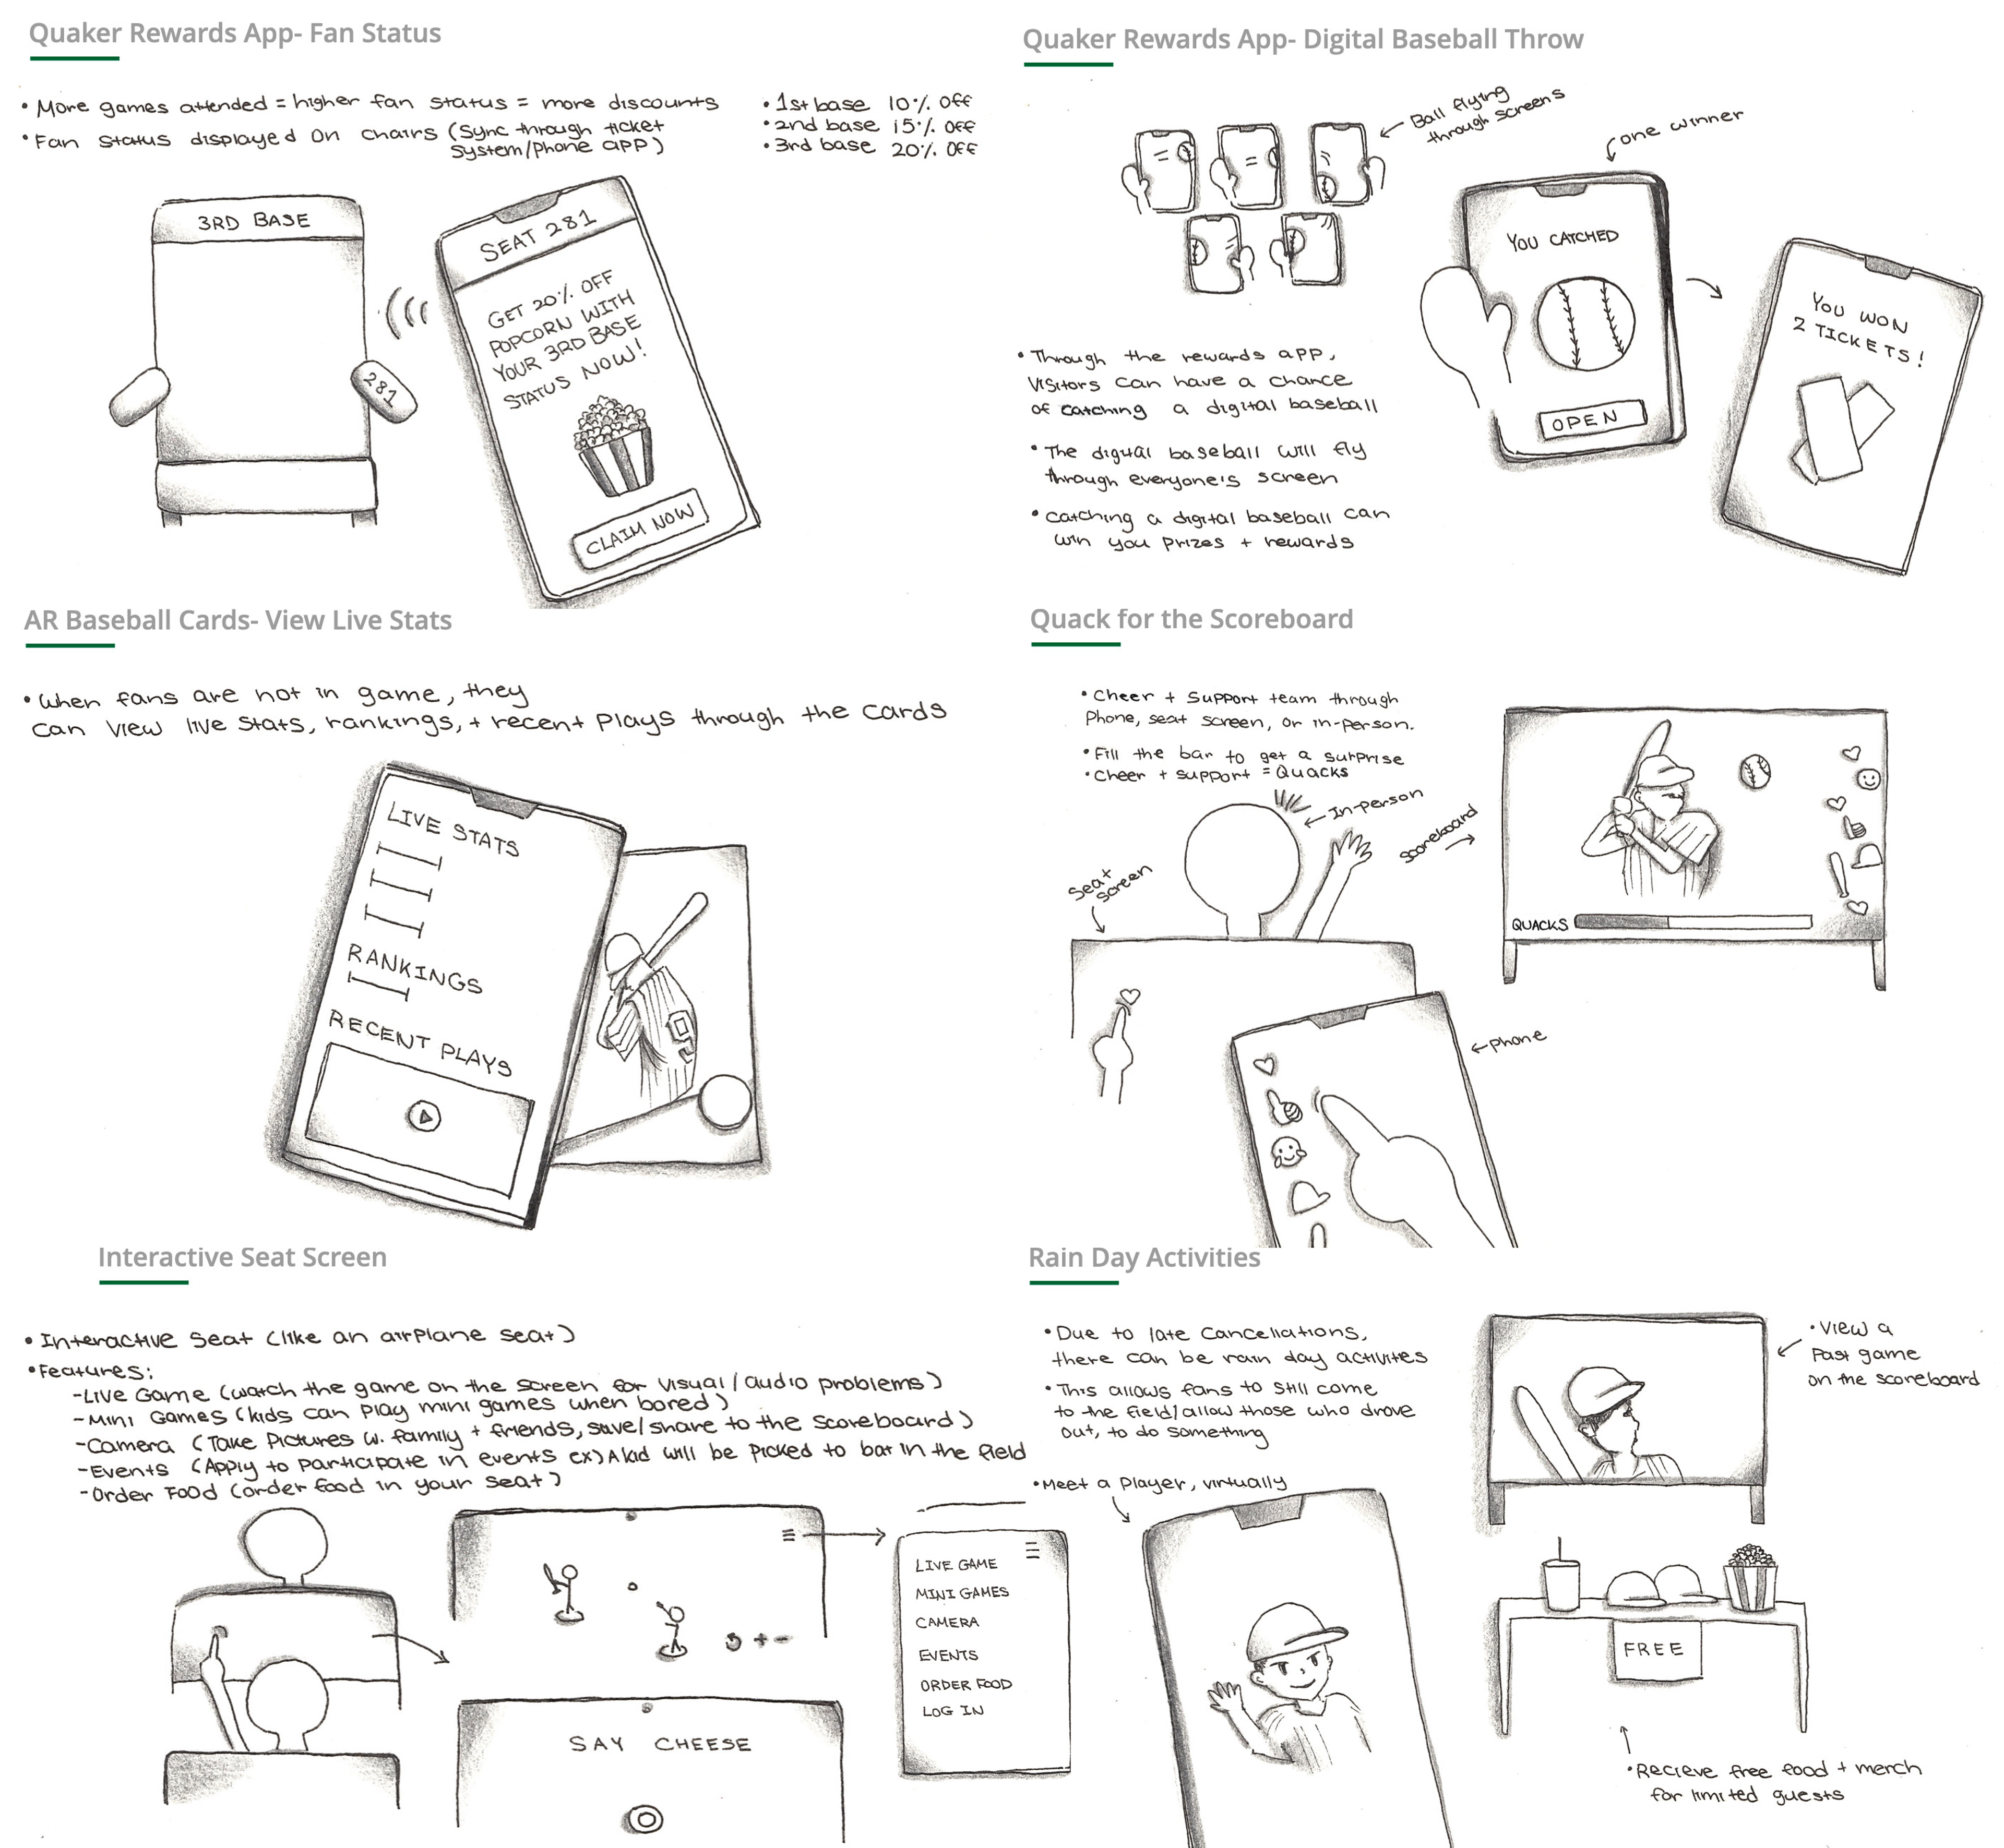
While brainstorming for possible solutions, below were some of the other solutions I have sketched out which focused on solving other problems.

Defining Elements
Ontology, topology, agency, and volatility
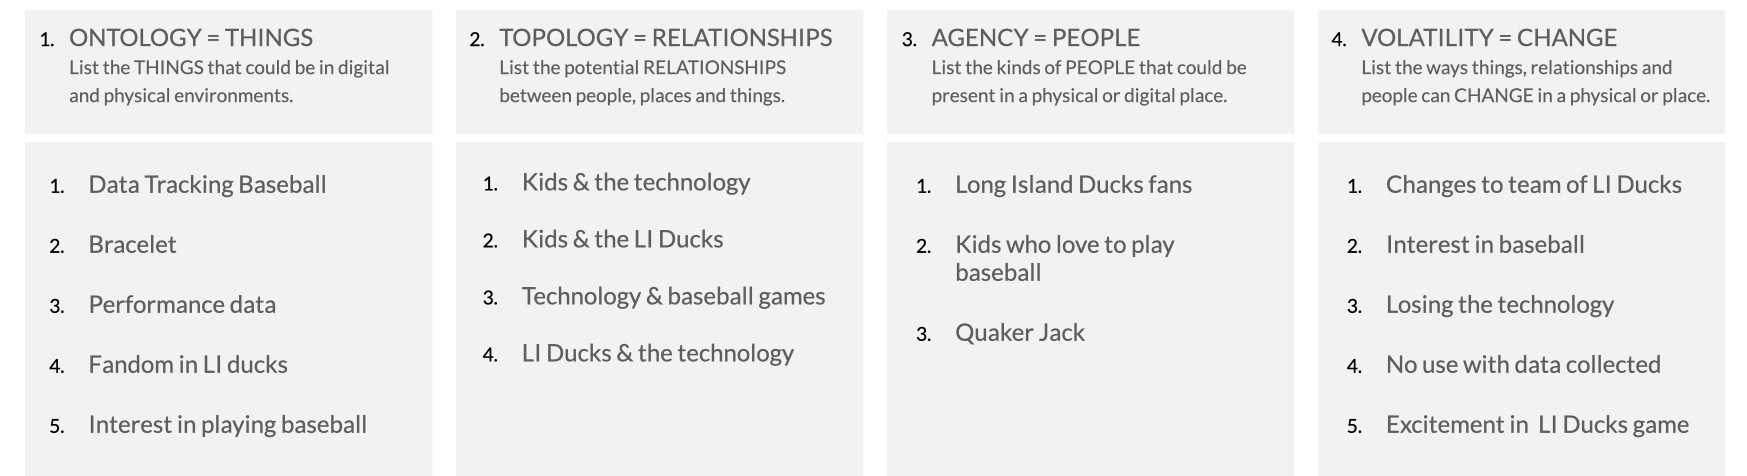
After choosing the idea to move forward with, the first step of developing a storyboard to further explain the product is by defining the elements below of Ontology (Things), Topology (Relationships), Agency (People), and Volatility (Change) for the product I would be creating. Defining the elements allows me to discover how my product would create relationships and engage with people.
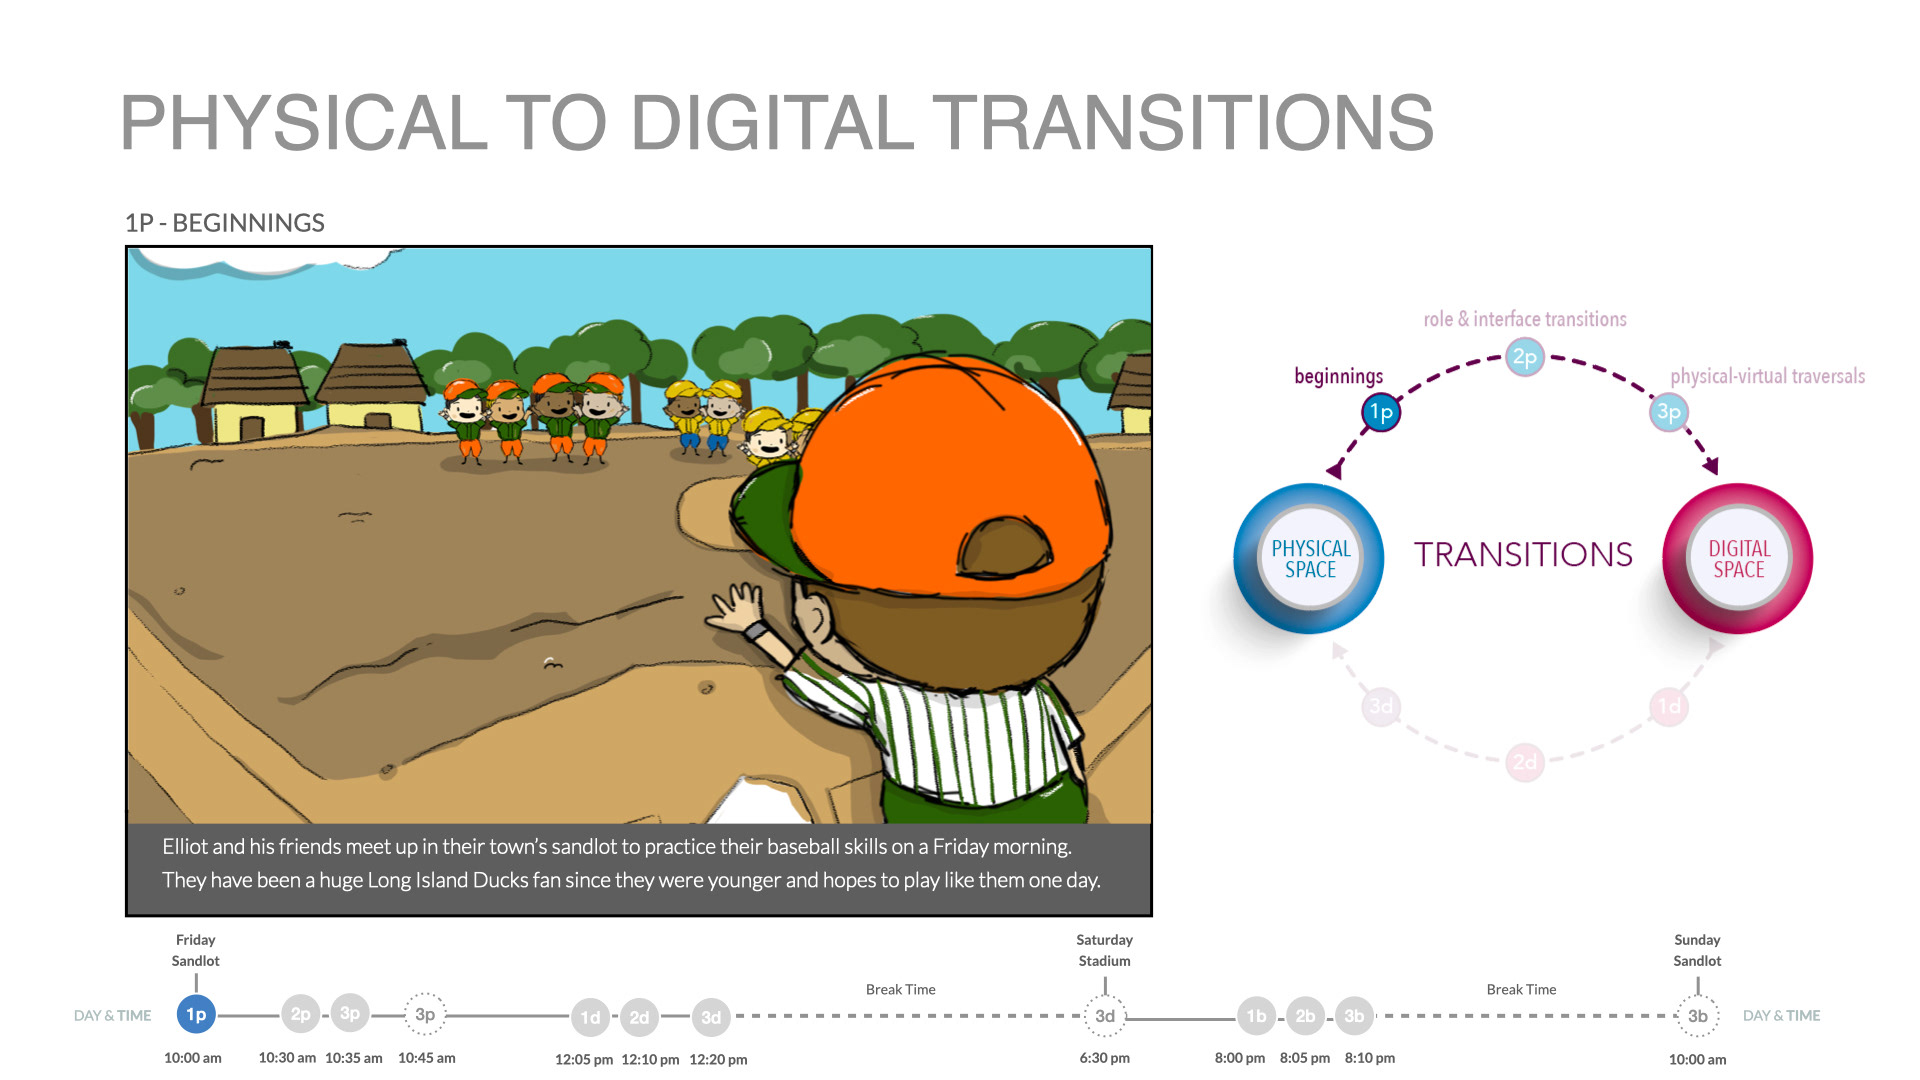
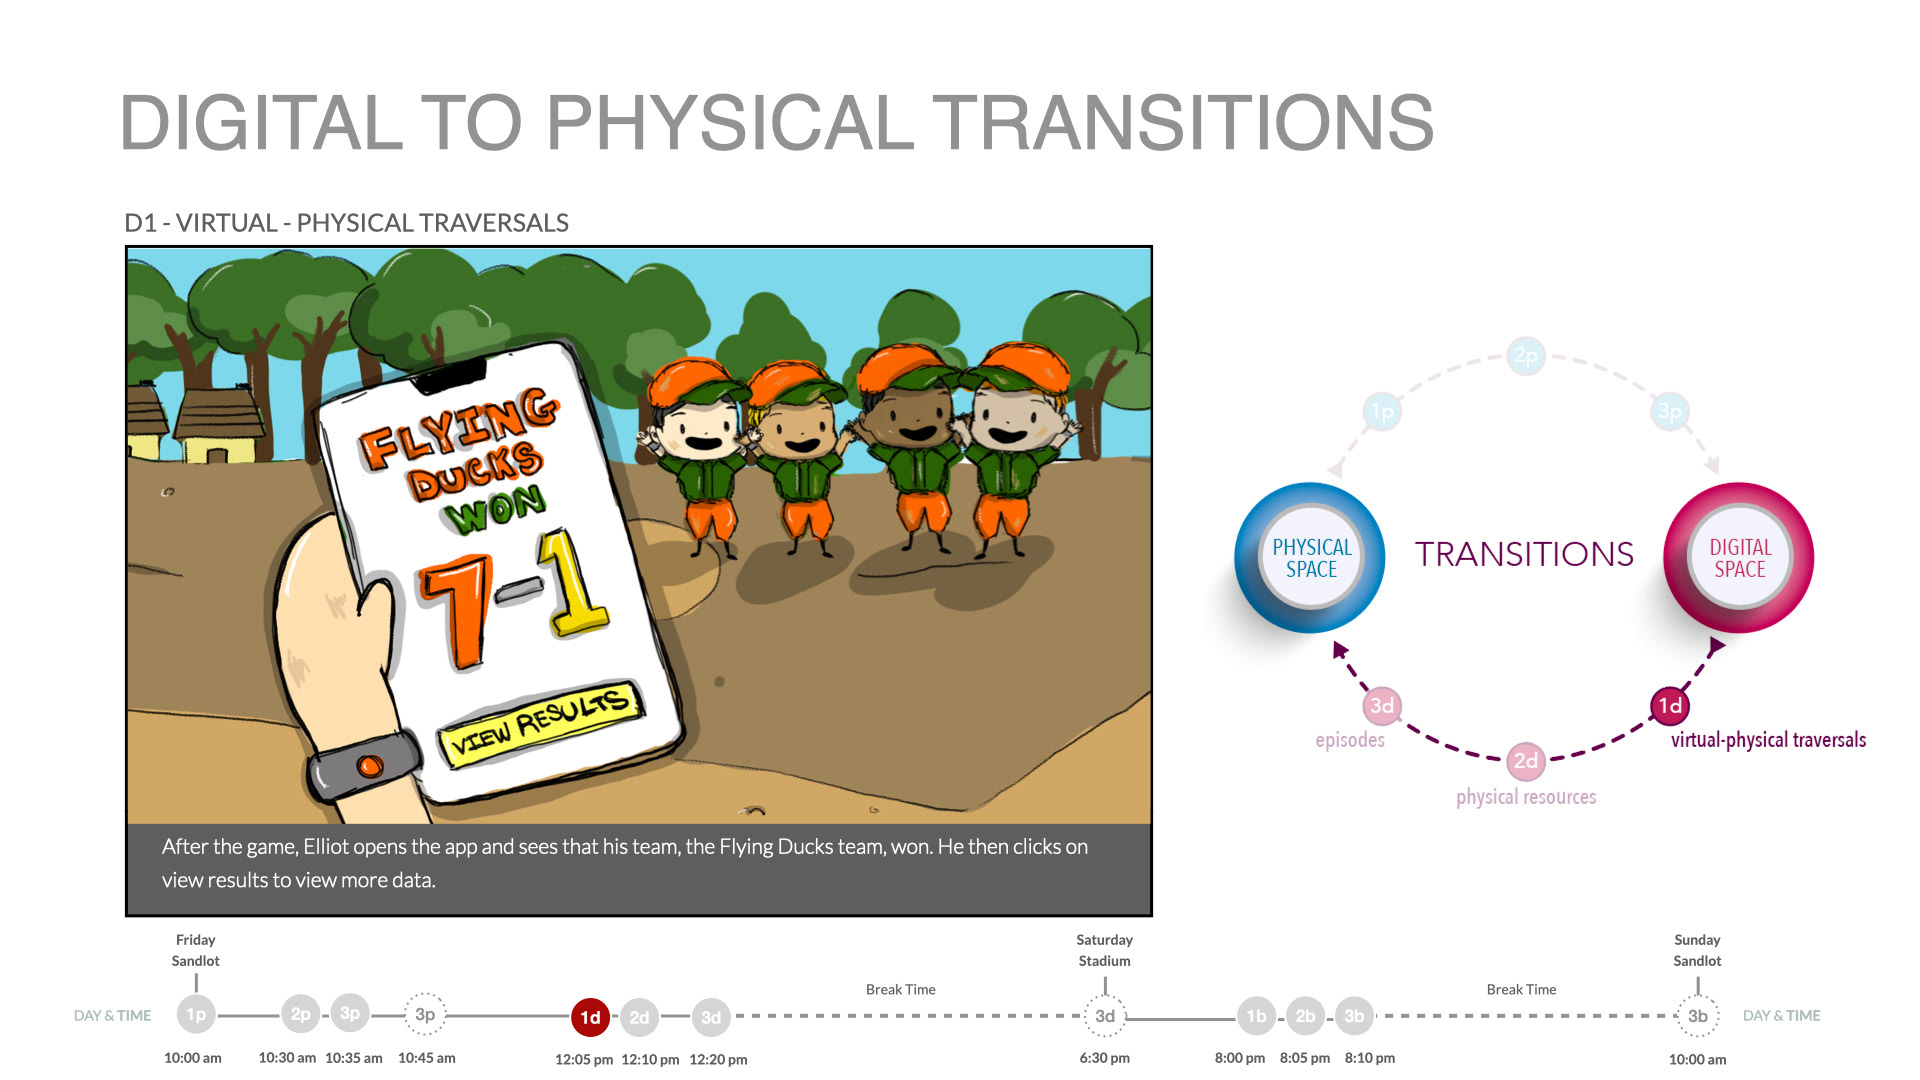
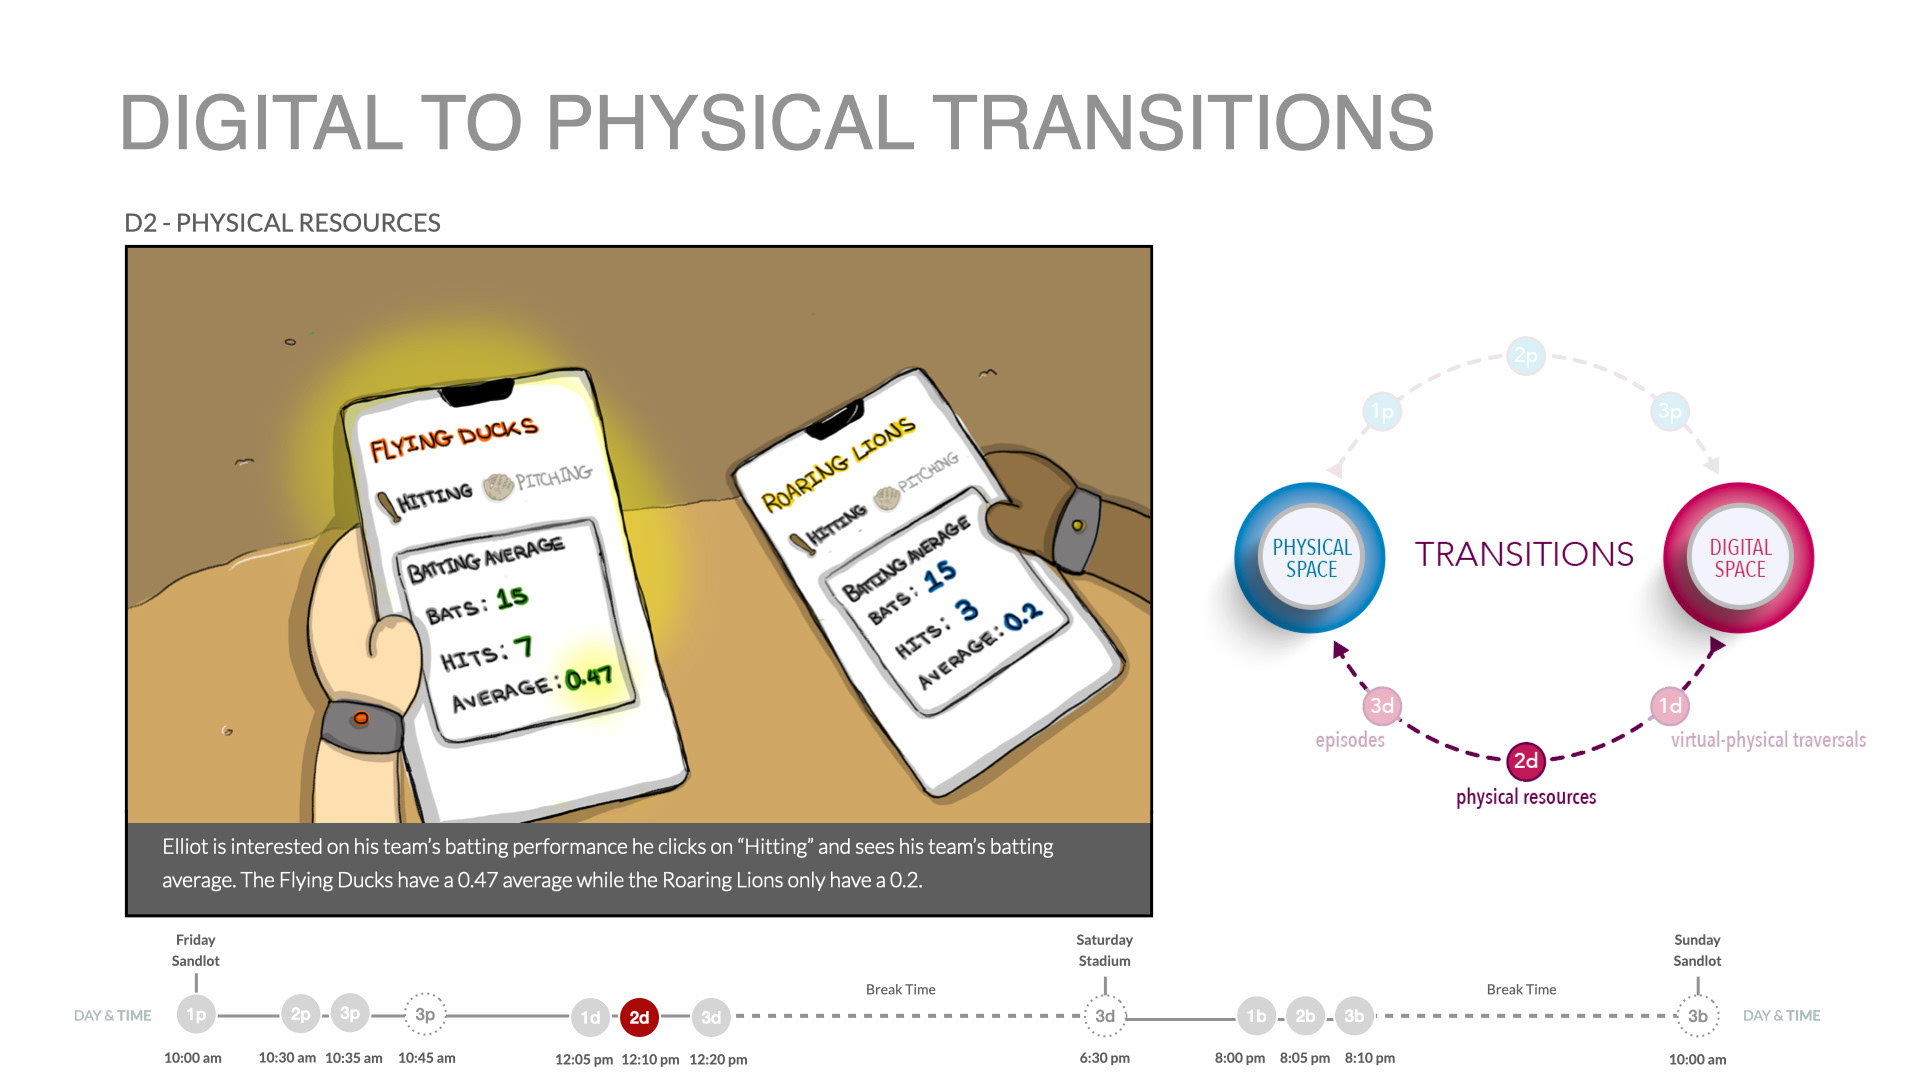
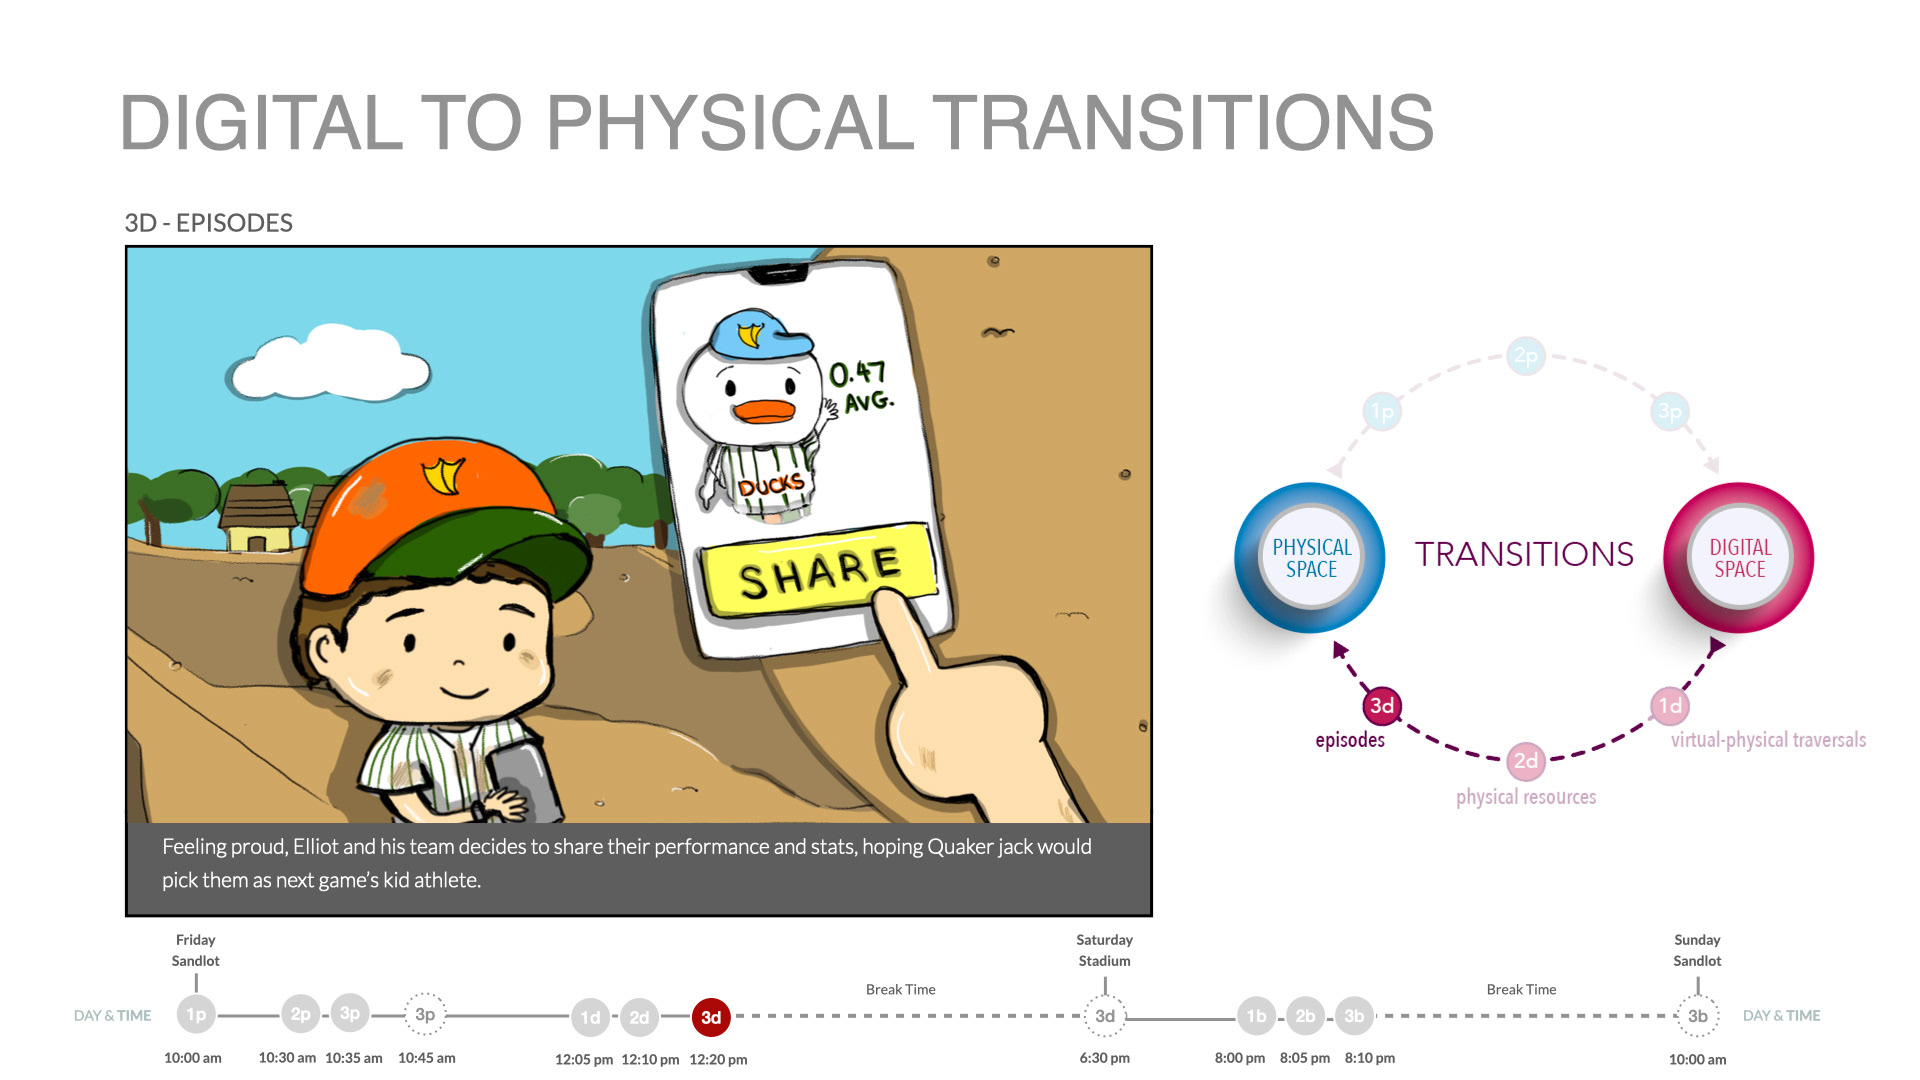
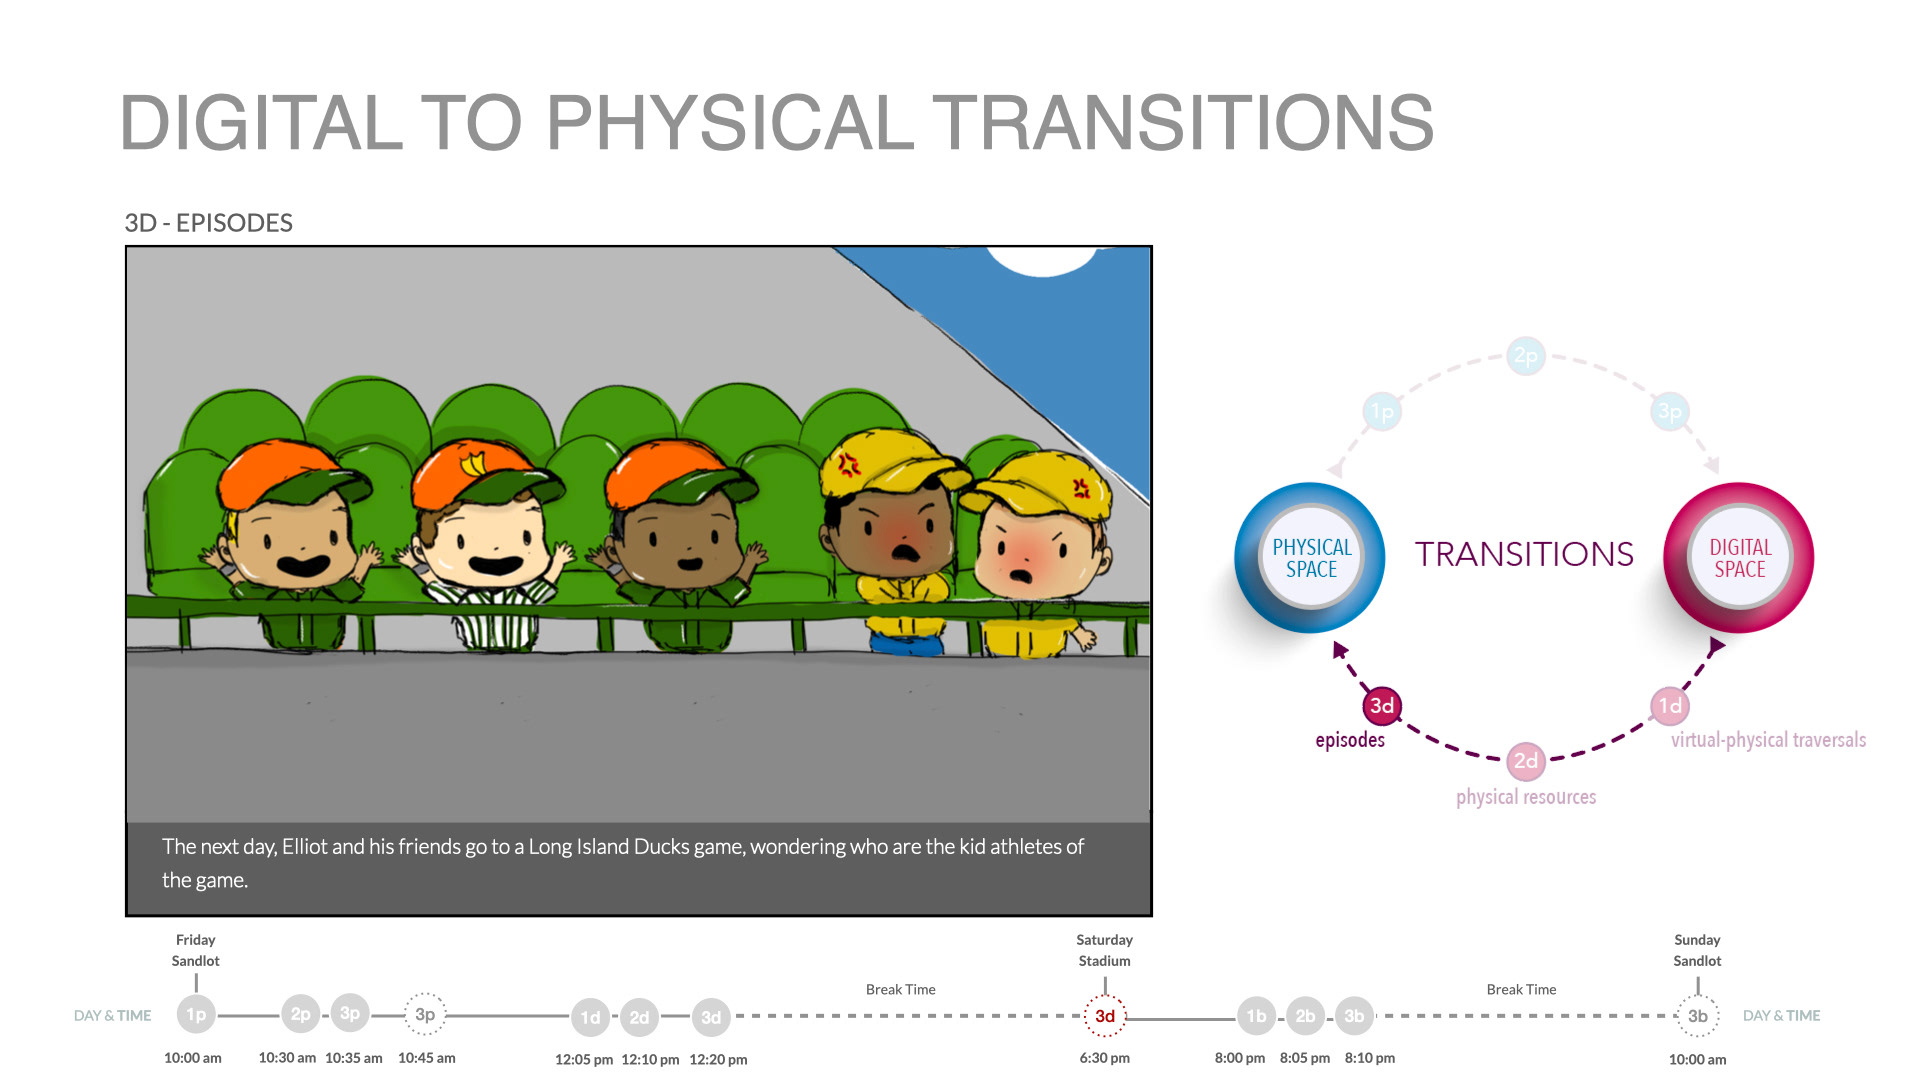
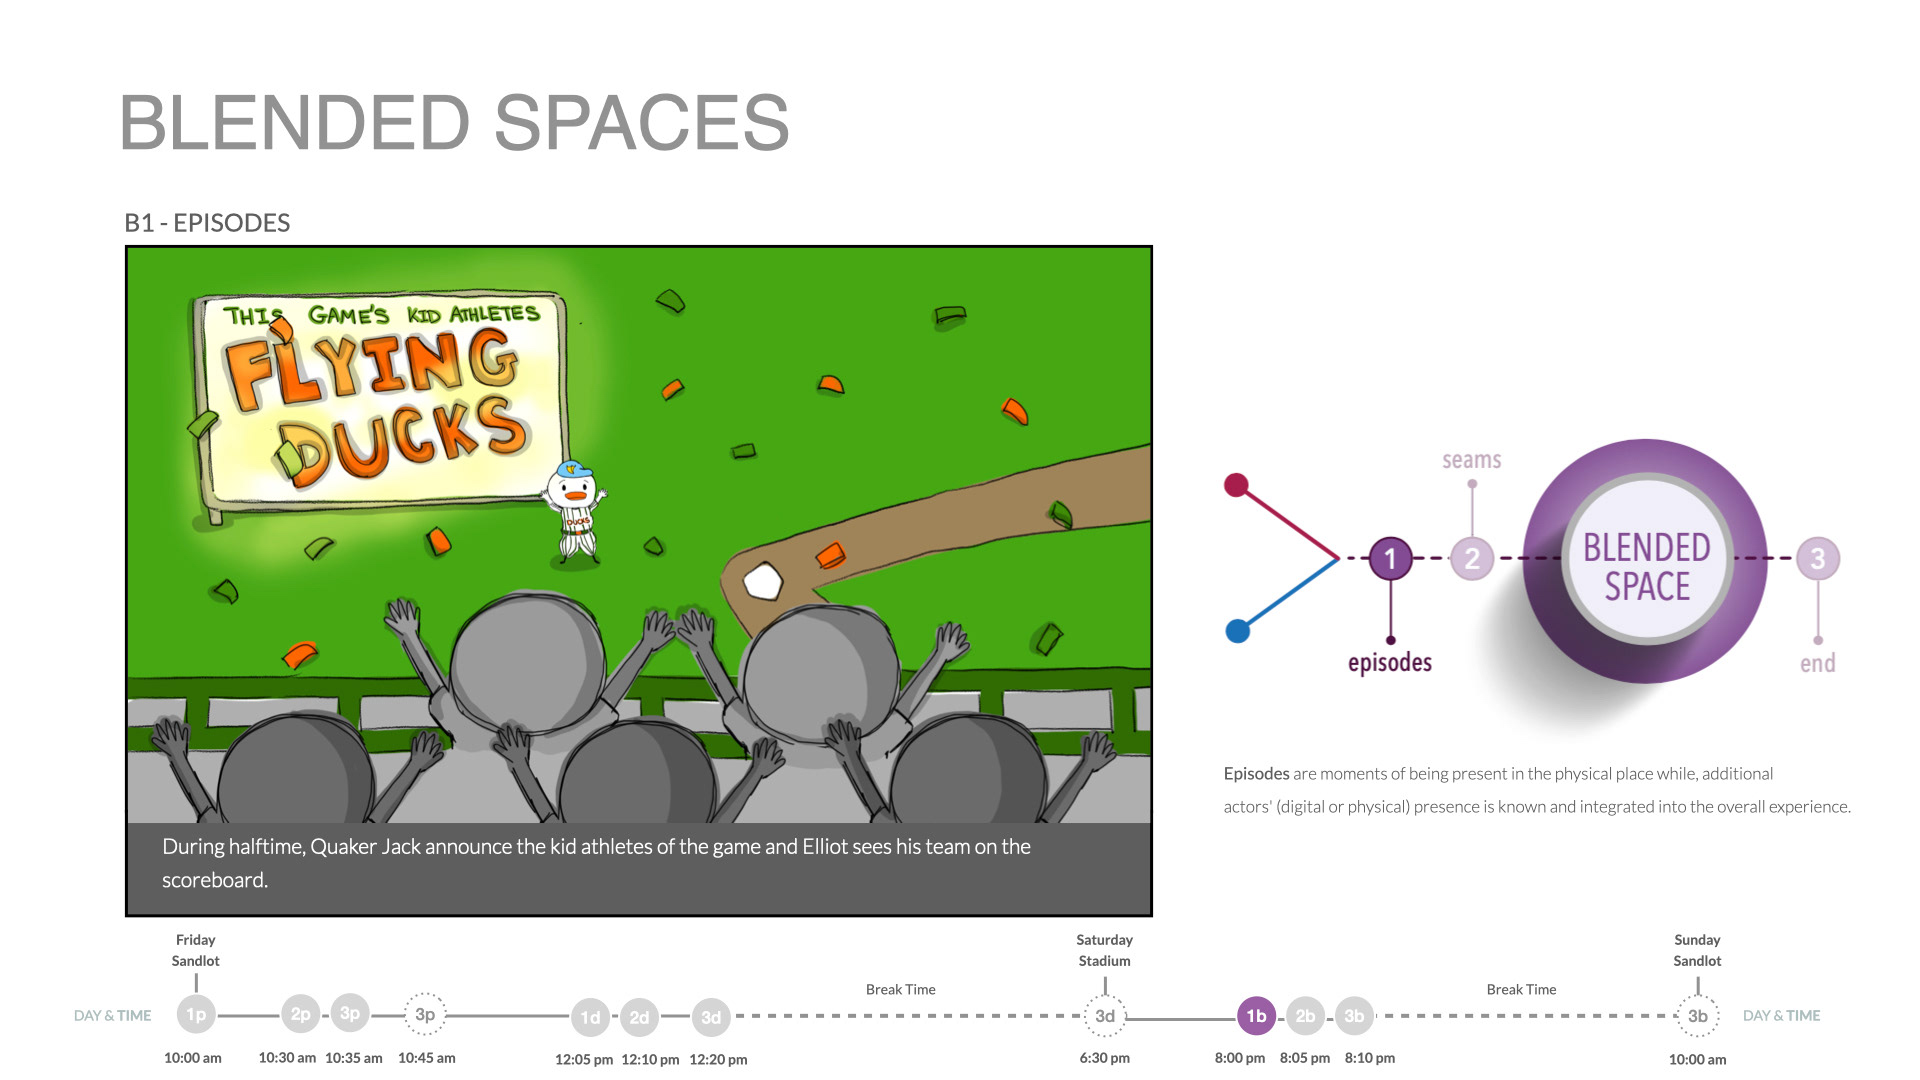
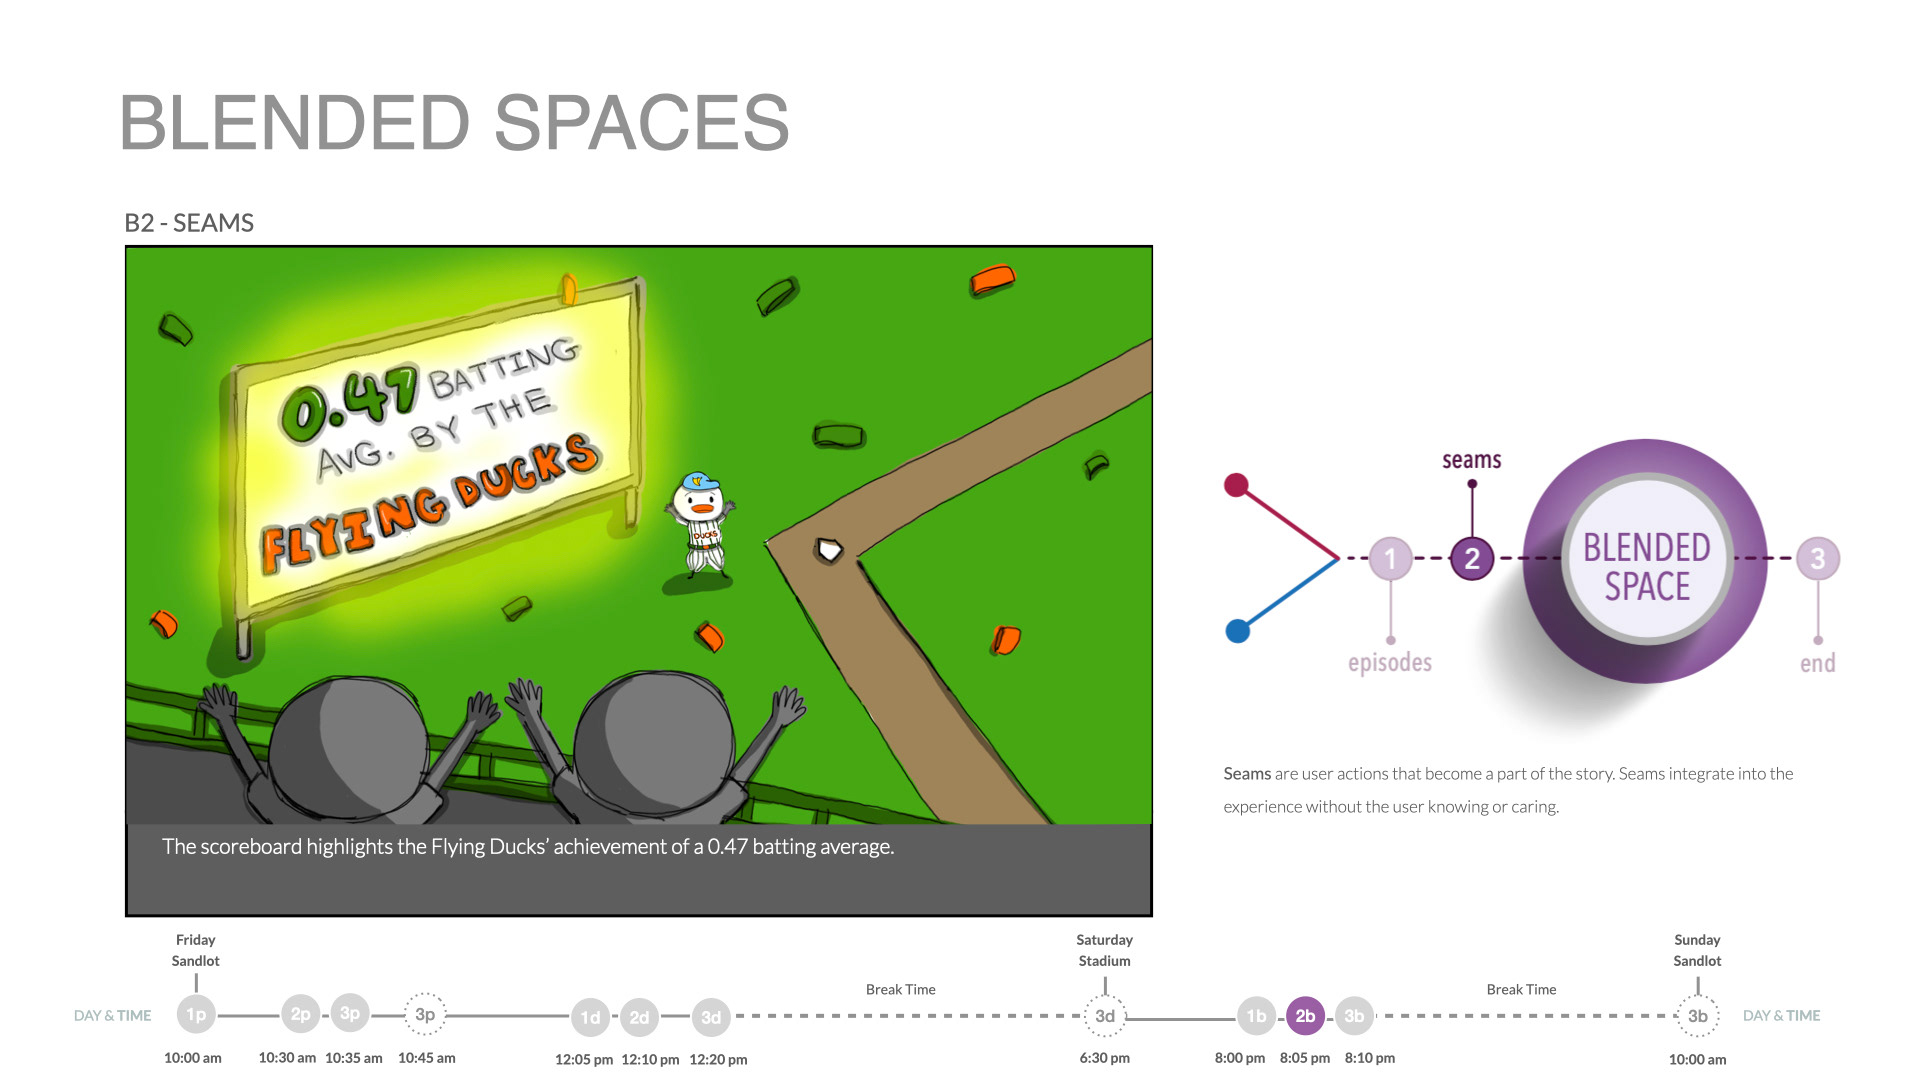
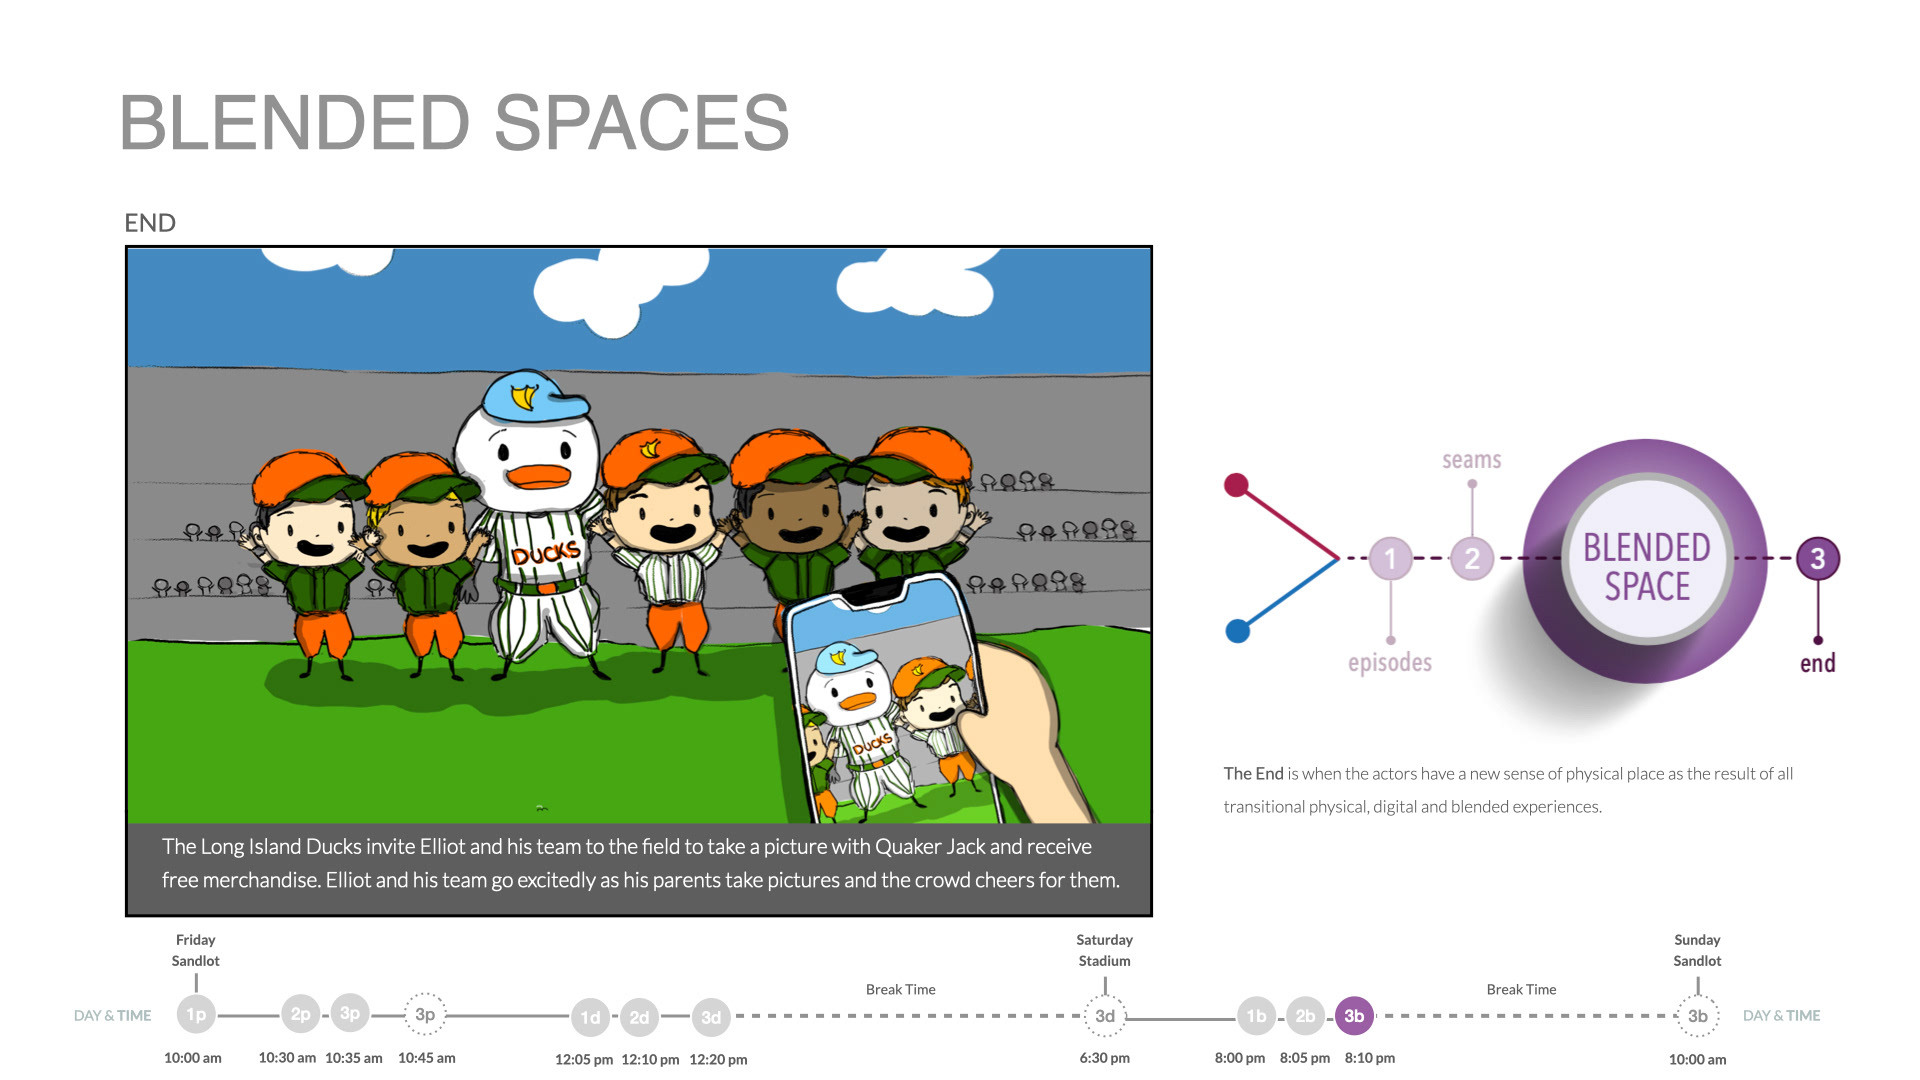
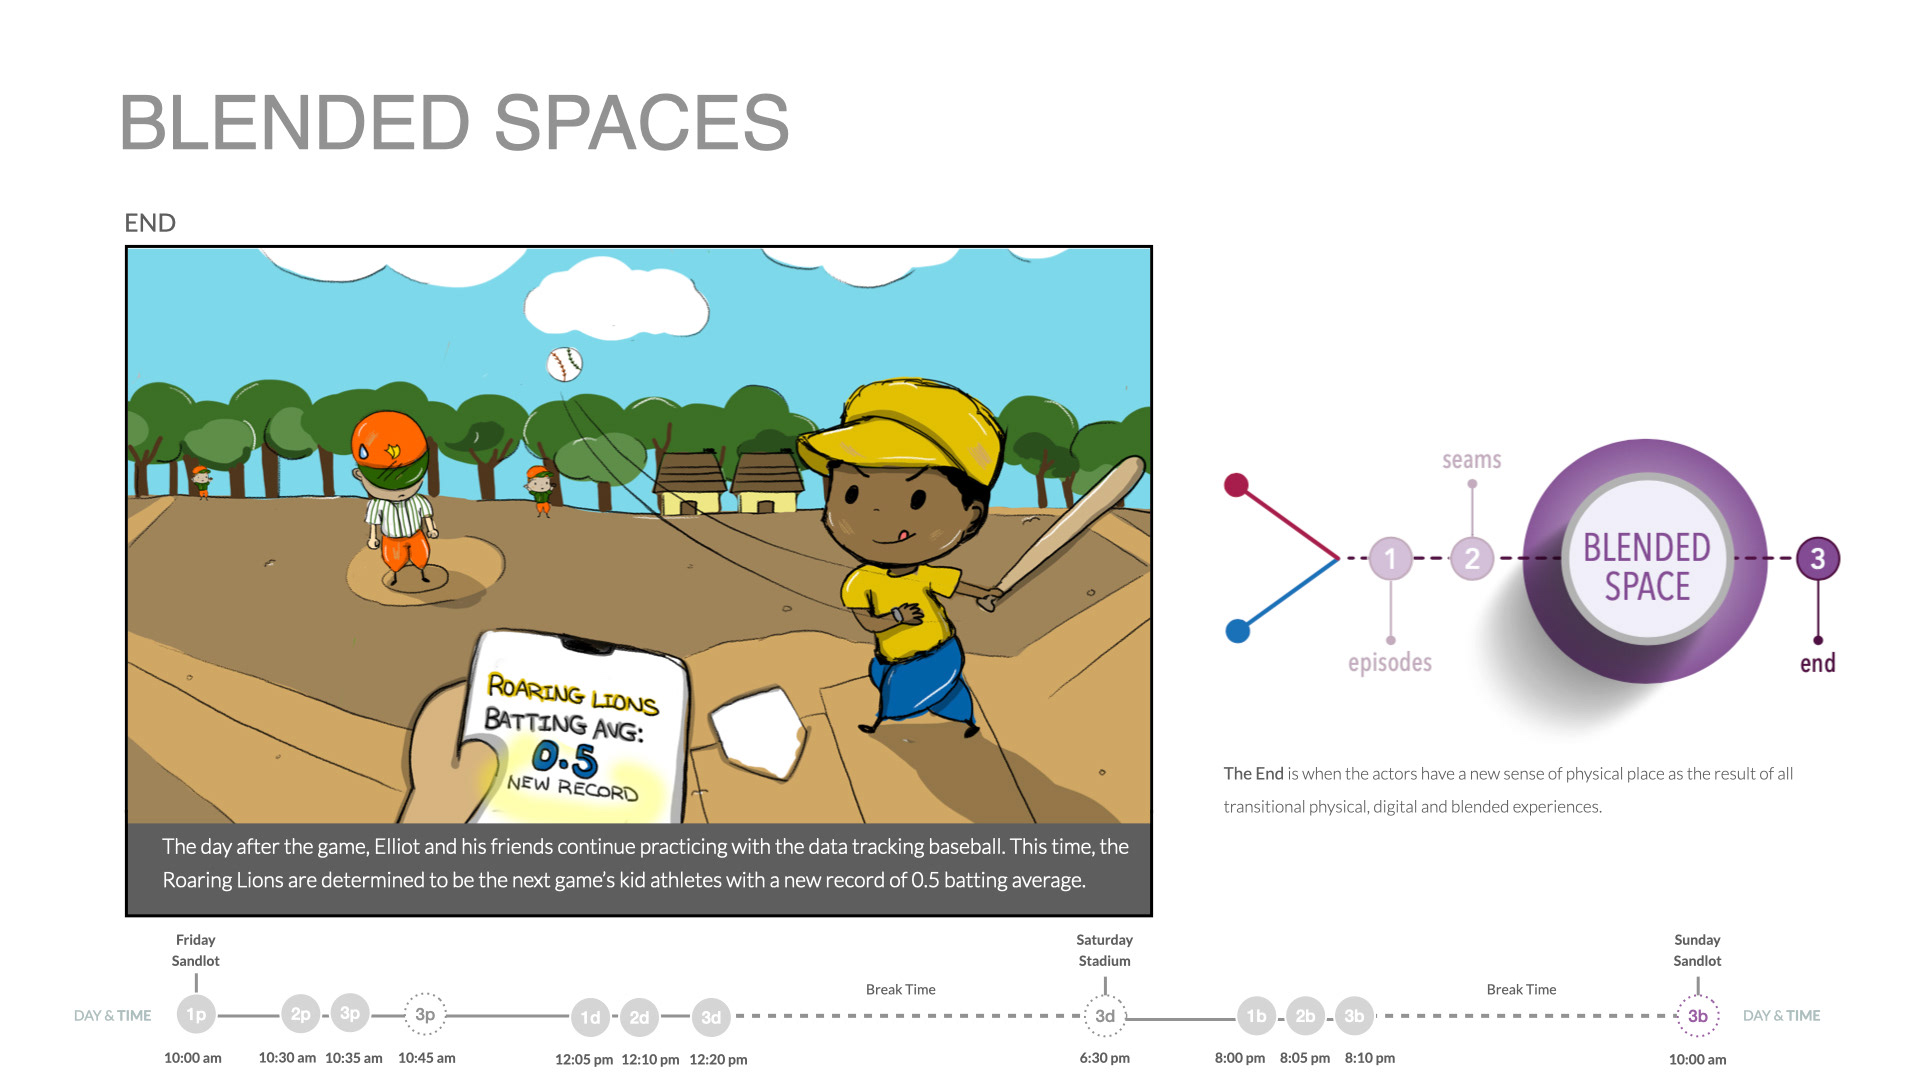
Physical and Digital Transitions
Physical, digital, or blended spaces
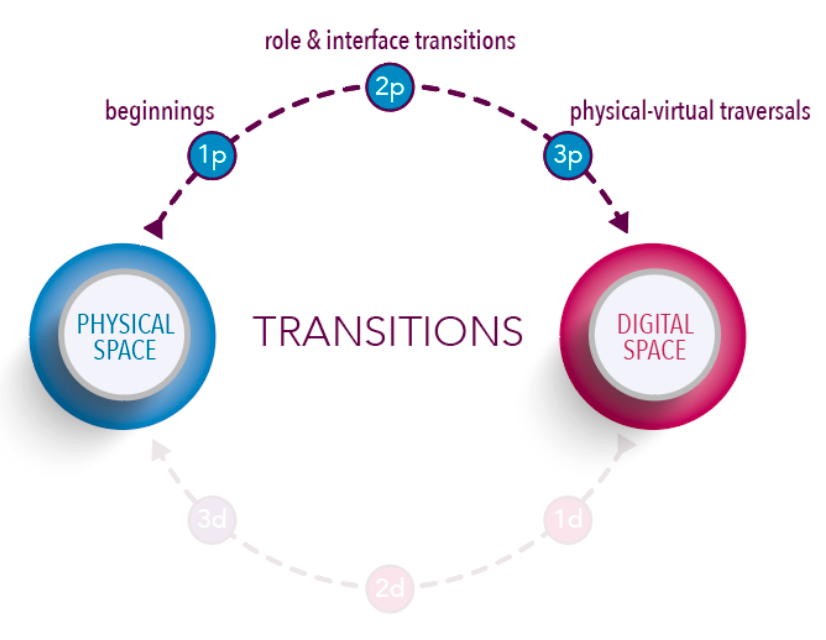
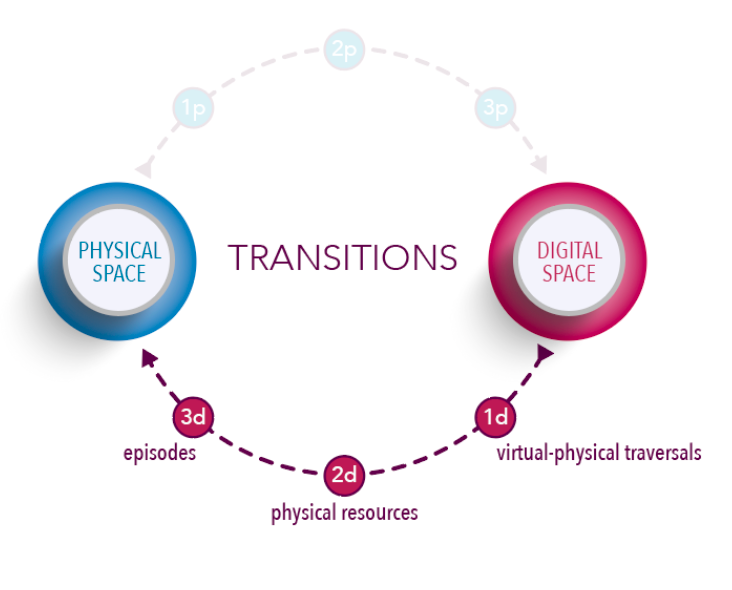
While creating my storyboard, it was important to keep in mind of the physical, digital, and blended space. The storyboard consists of 12 cells in which 4 cells are used to showcase each of the three spaces. Below shows each of the three spaces and how they transition into another space. By following these transitions, I was able to illustrate my storyboard effectively in terms of showing how the product can be used in the three spaces.

Building a Script
3 touchpoints per space
In the second step of developing my storyboard, I began to write up a script while following the transitions listed below. Since there are three main touchpoints in each transition, those are shown through the solid colored circles. The fourth touchpoints, which are optional and can be positioned in any of the three spaces, are indicated by the dotted circles.
Timeline of Touchpoints
Time, place, and space
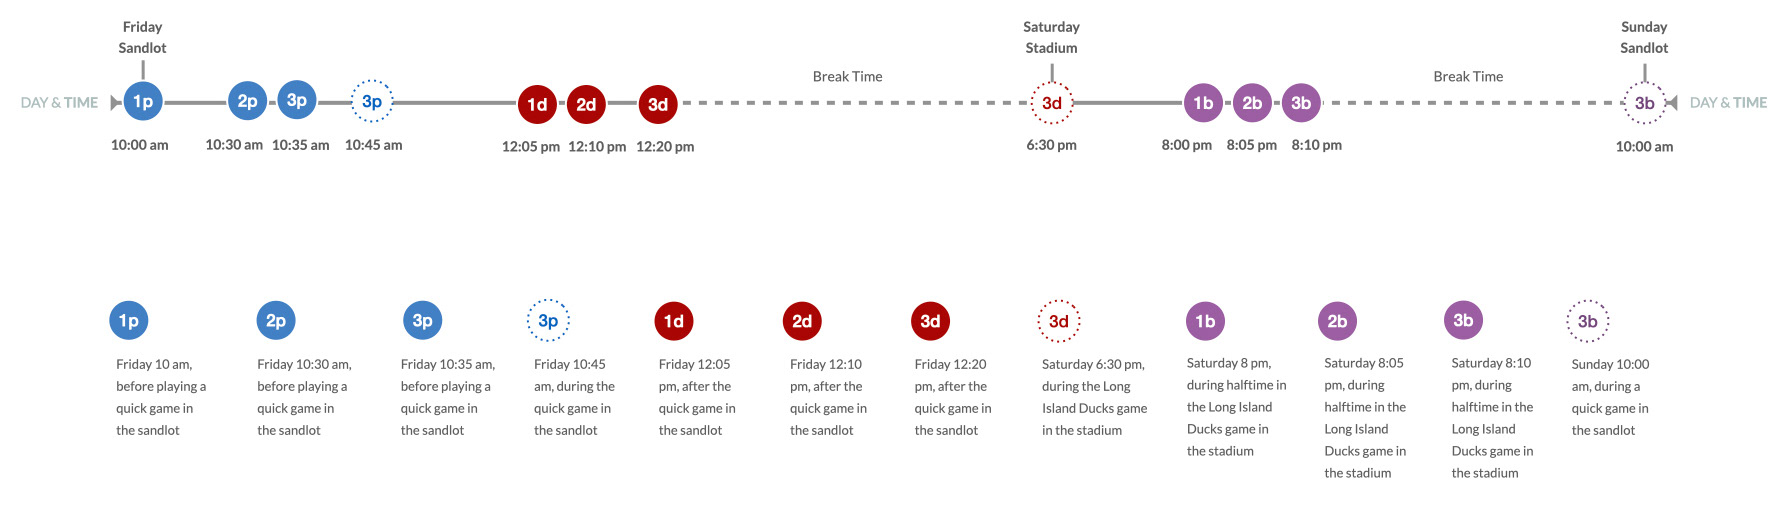
After writing the script, I described the time and place of each touchpoint and organized them through a timeline.
Spaces Within the Timeline
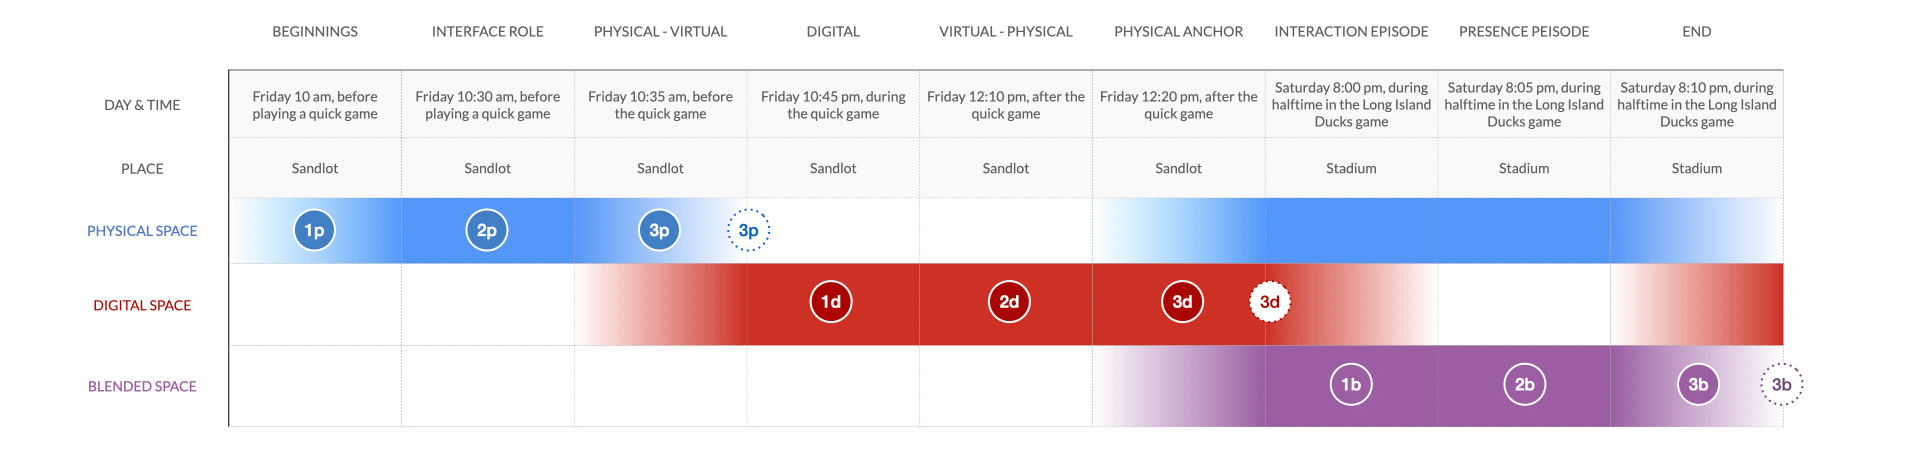
Overlapping spaces
In the last step before I began illustrating my storyboard, I described the time, place, and space through a timeline. This timeline focuses on when the spaces may overlap throughout the story.
Illustrating the Storyboard
7 weeks of drawing
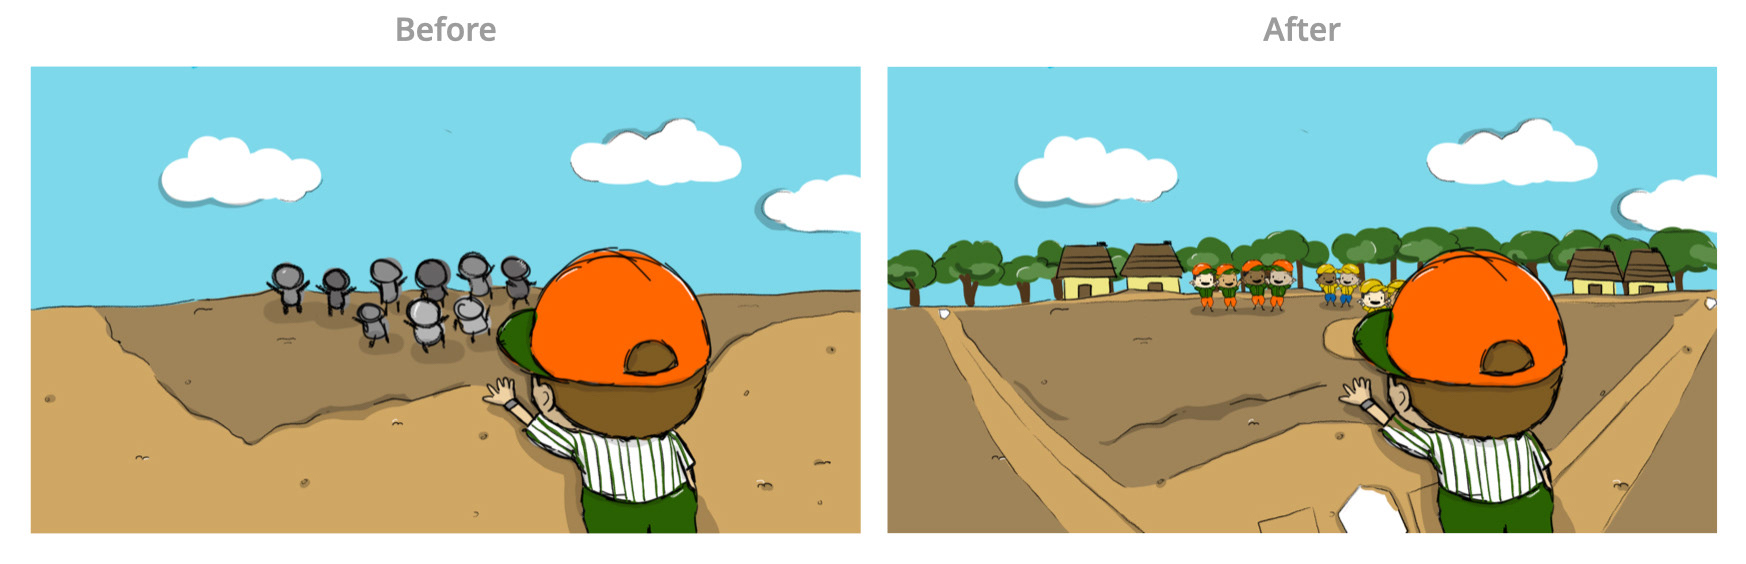
The illustration of my storyboard took around 7 weeks to fully complete as it required many alterations and drafts. Below is an example of the first version compared to the final version of a cell. The storyboard's style was heavily influenced by cartoons and children's drawings. Since the product was created and designed for kids, I aimed to make the storyboard appear vibrant, engaging, and fun.
Final Storyboard
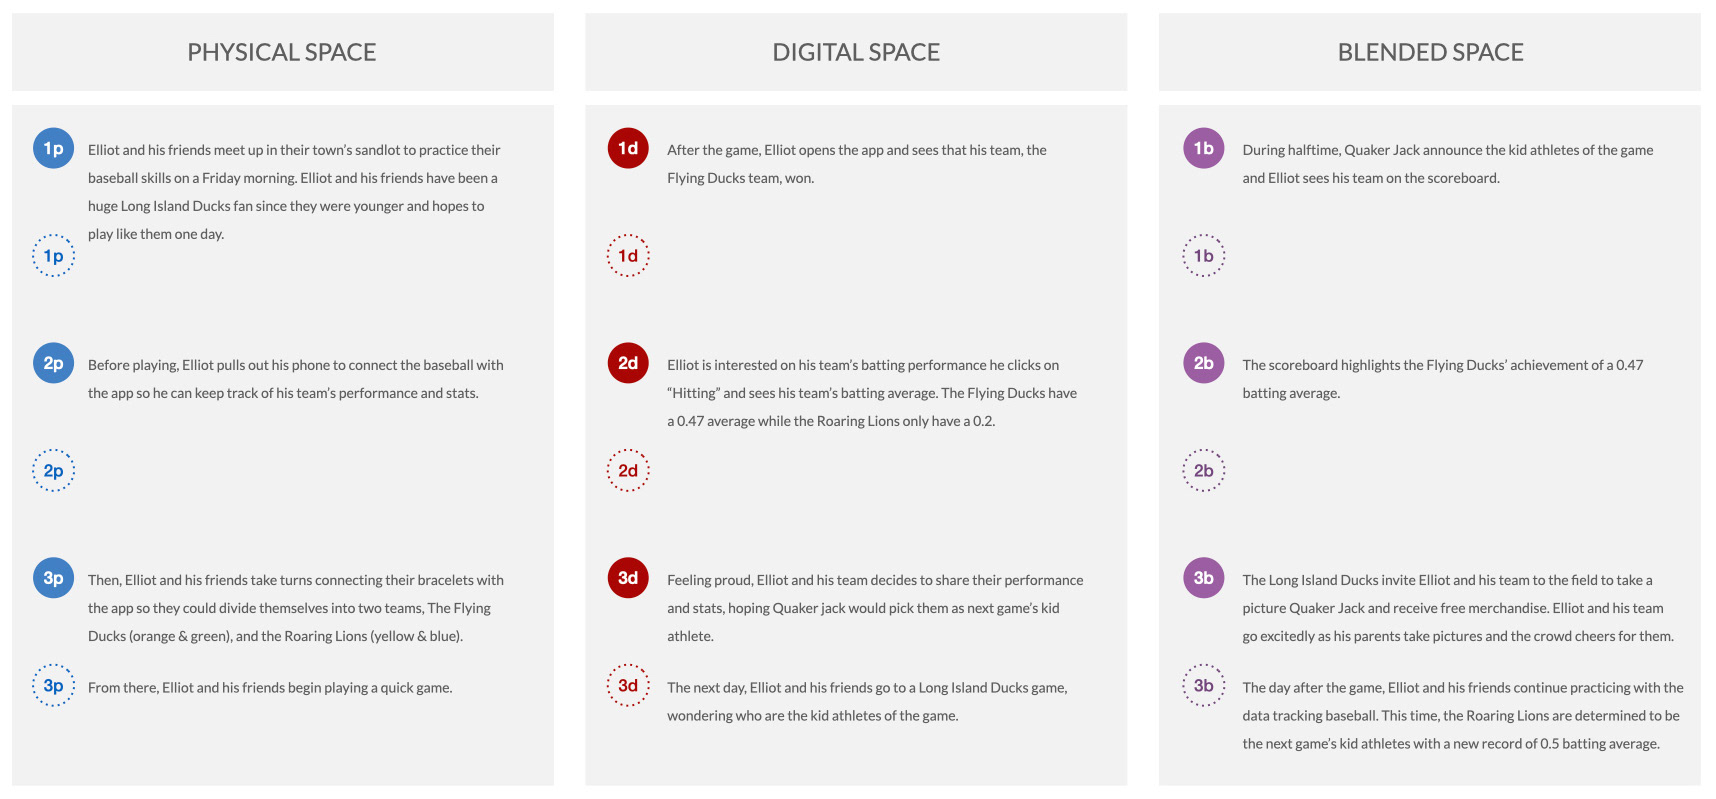
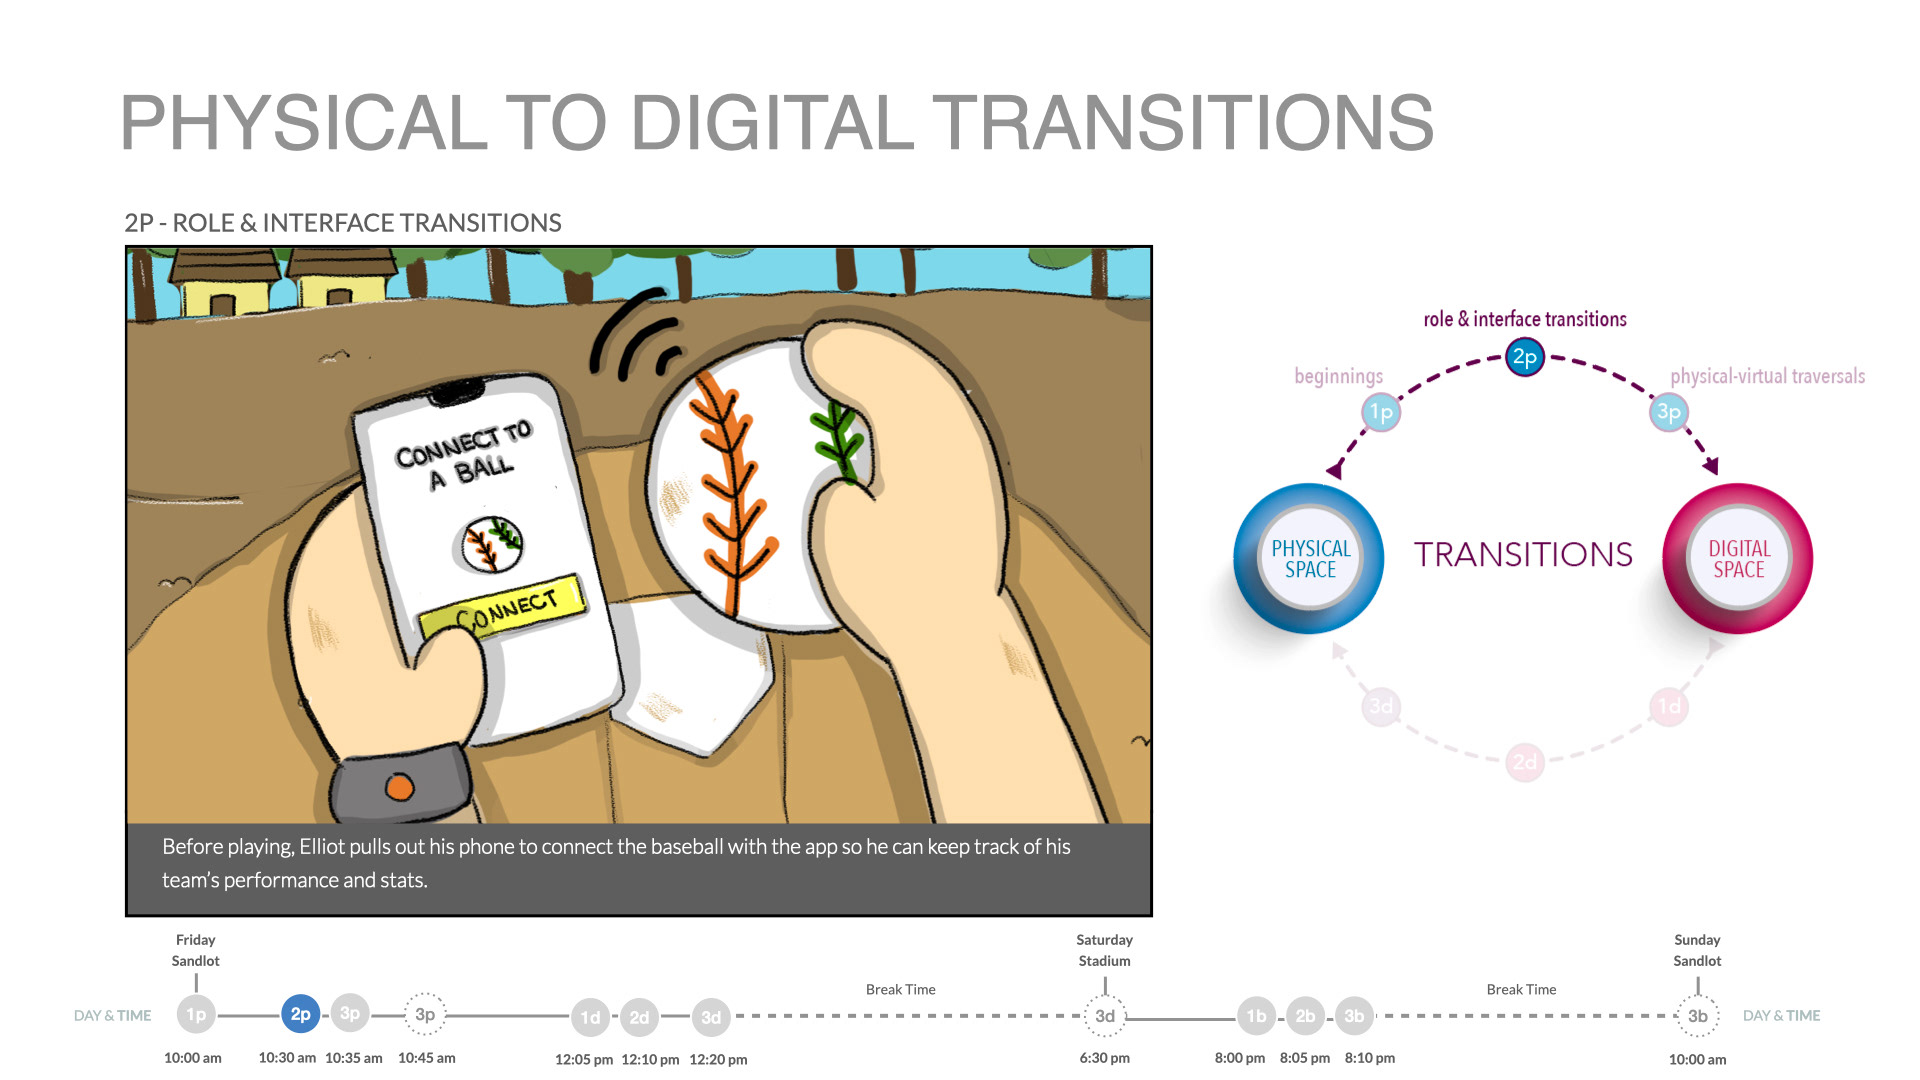
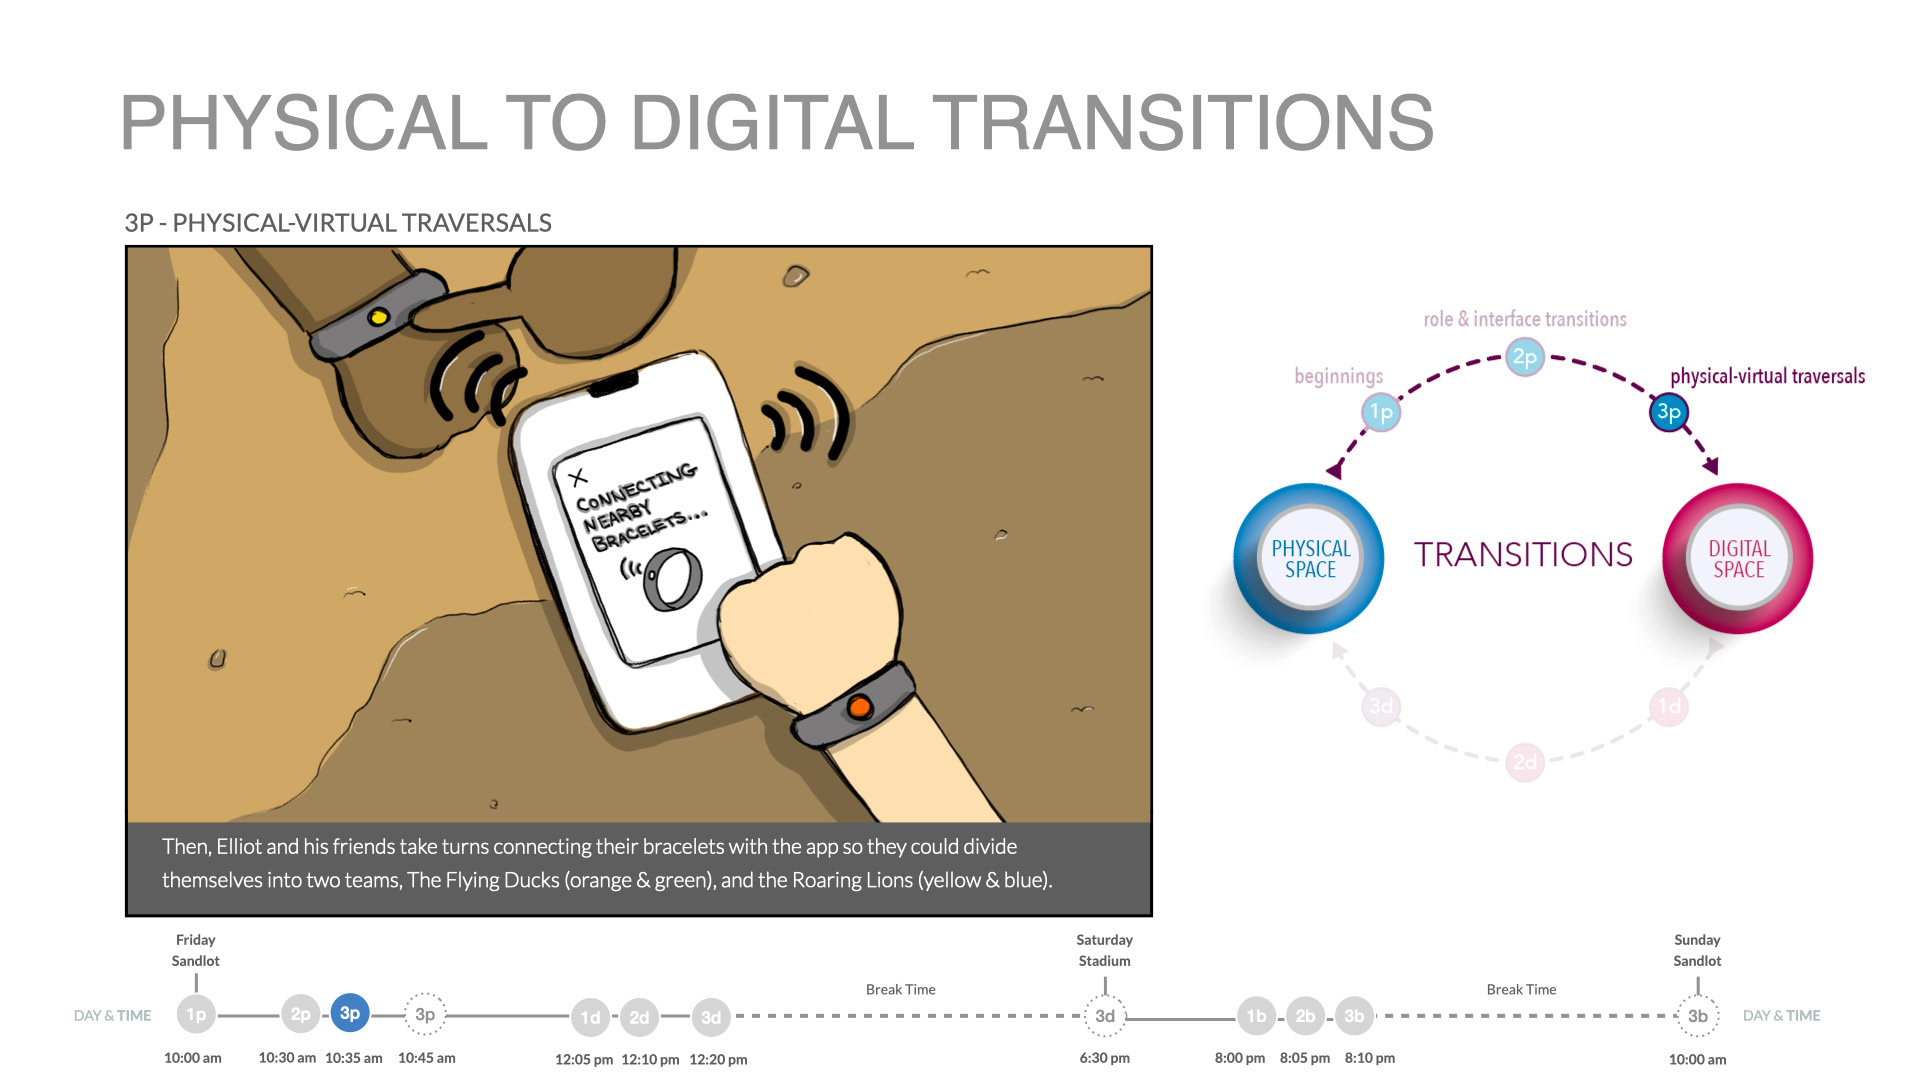
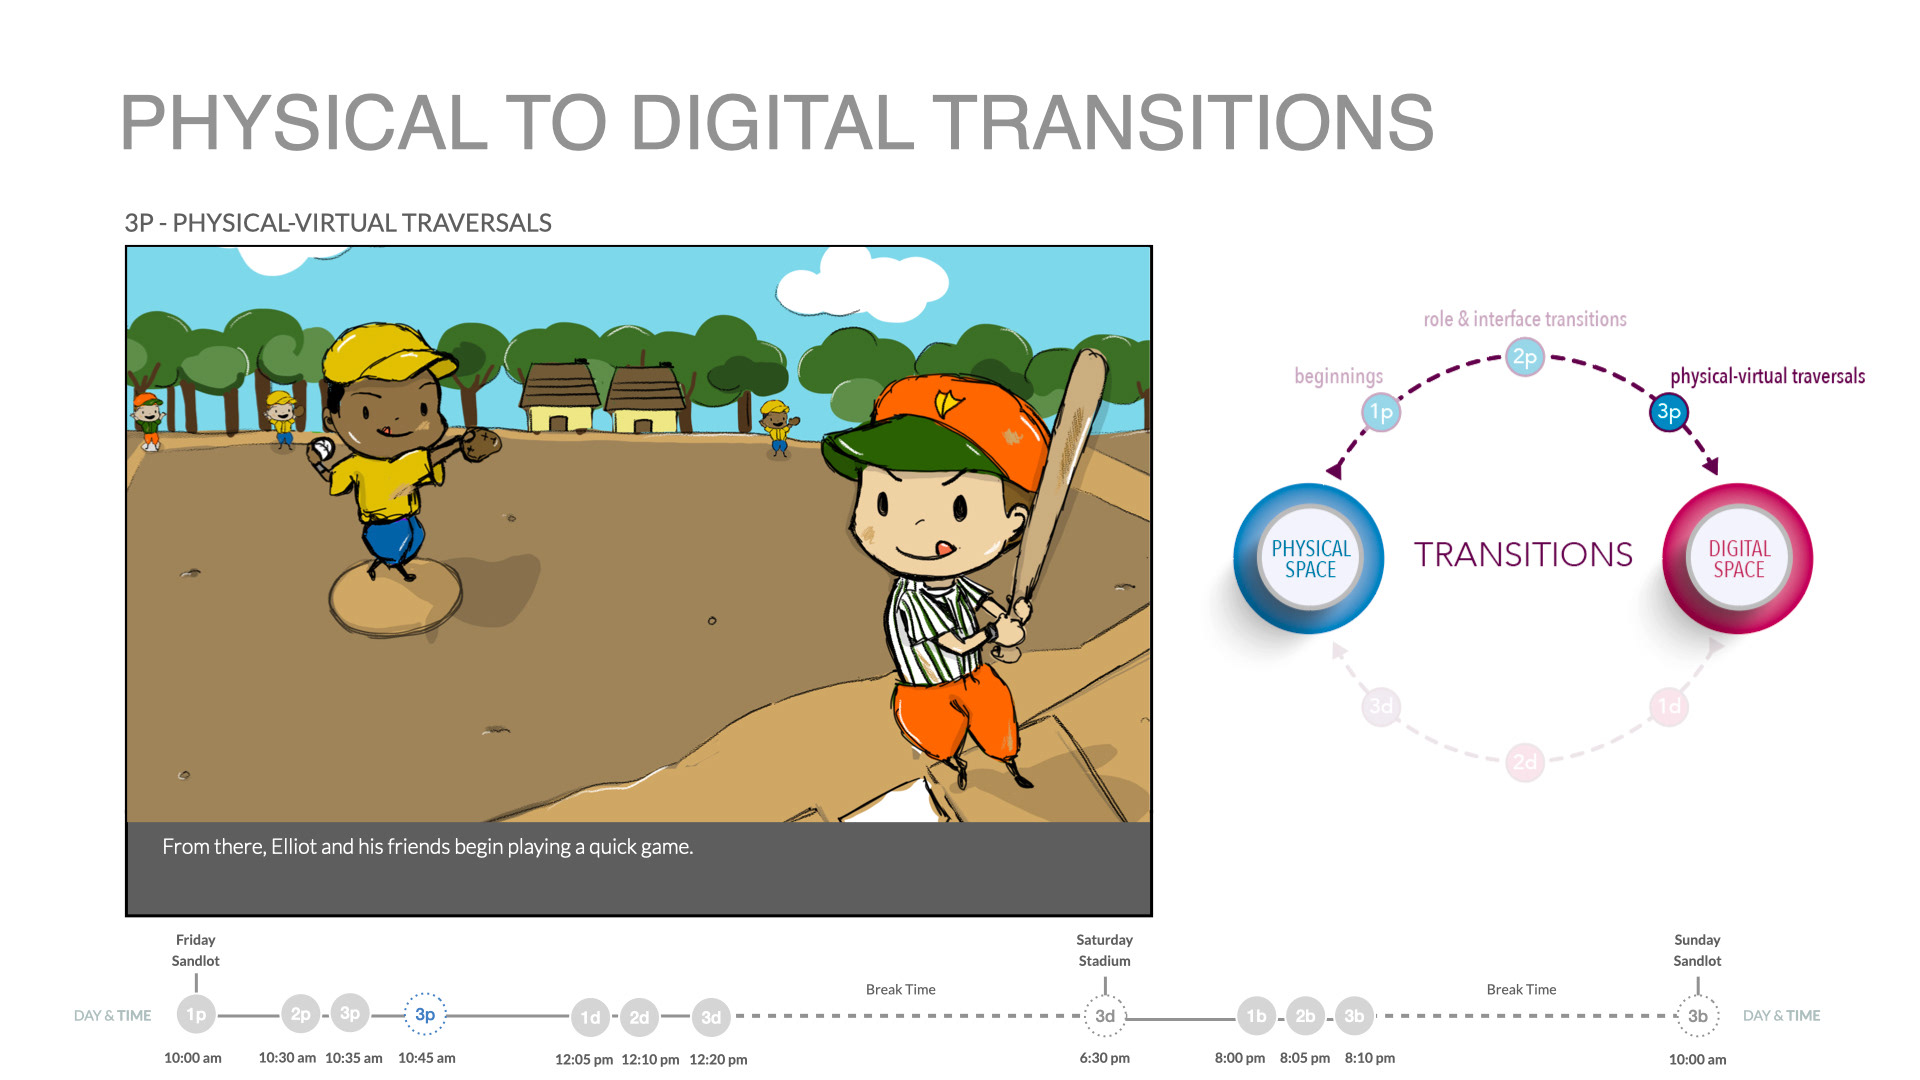
Elliot and his Data-Tracking Baseball
Below is the final version of my storyboard. In addition to the illustrations and captions, each cell includes a timeline that indicates the touchpoint and space corresponding to that cell. My storyboard narrates the story of Elliot and his friends as they practice baseball in their town's sandlot in the hopes of being selected by Quaker Jack as the next Kid Athlete for the Long Island Ducks. They utilize a data-tracking baseball, along with bracelets and the app, to monitor their performance. Click on the photos for a more detailed view.
Storyboard Evaluation
Most successful storyboard among peers
After developing my storyboard, my storyboard was sent to other Interaction Design students along with the evaluation survey created by my professor, to study the quality of my story and product. Below are examples of questions from the evaluations and the standard deviations based on the data collected. Standard deviations of my peers' storyboards are displayed (A,C,D,E,F), as my storyboard was highlighted as B. Our goal was to achieve a low standard deviation, preferably under 0 to have a high quality story and product. With the lowest standard deviations among my peers, my storyboard and product was determined the highest quality and most successful.
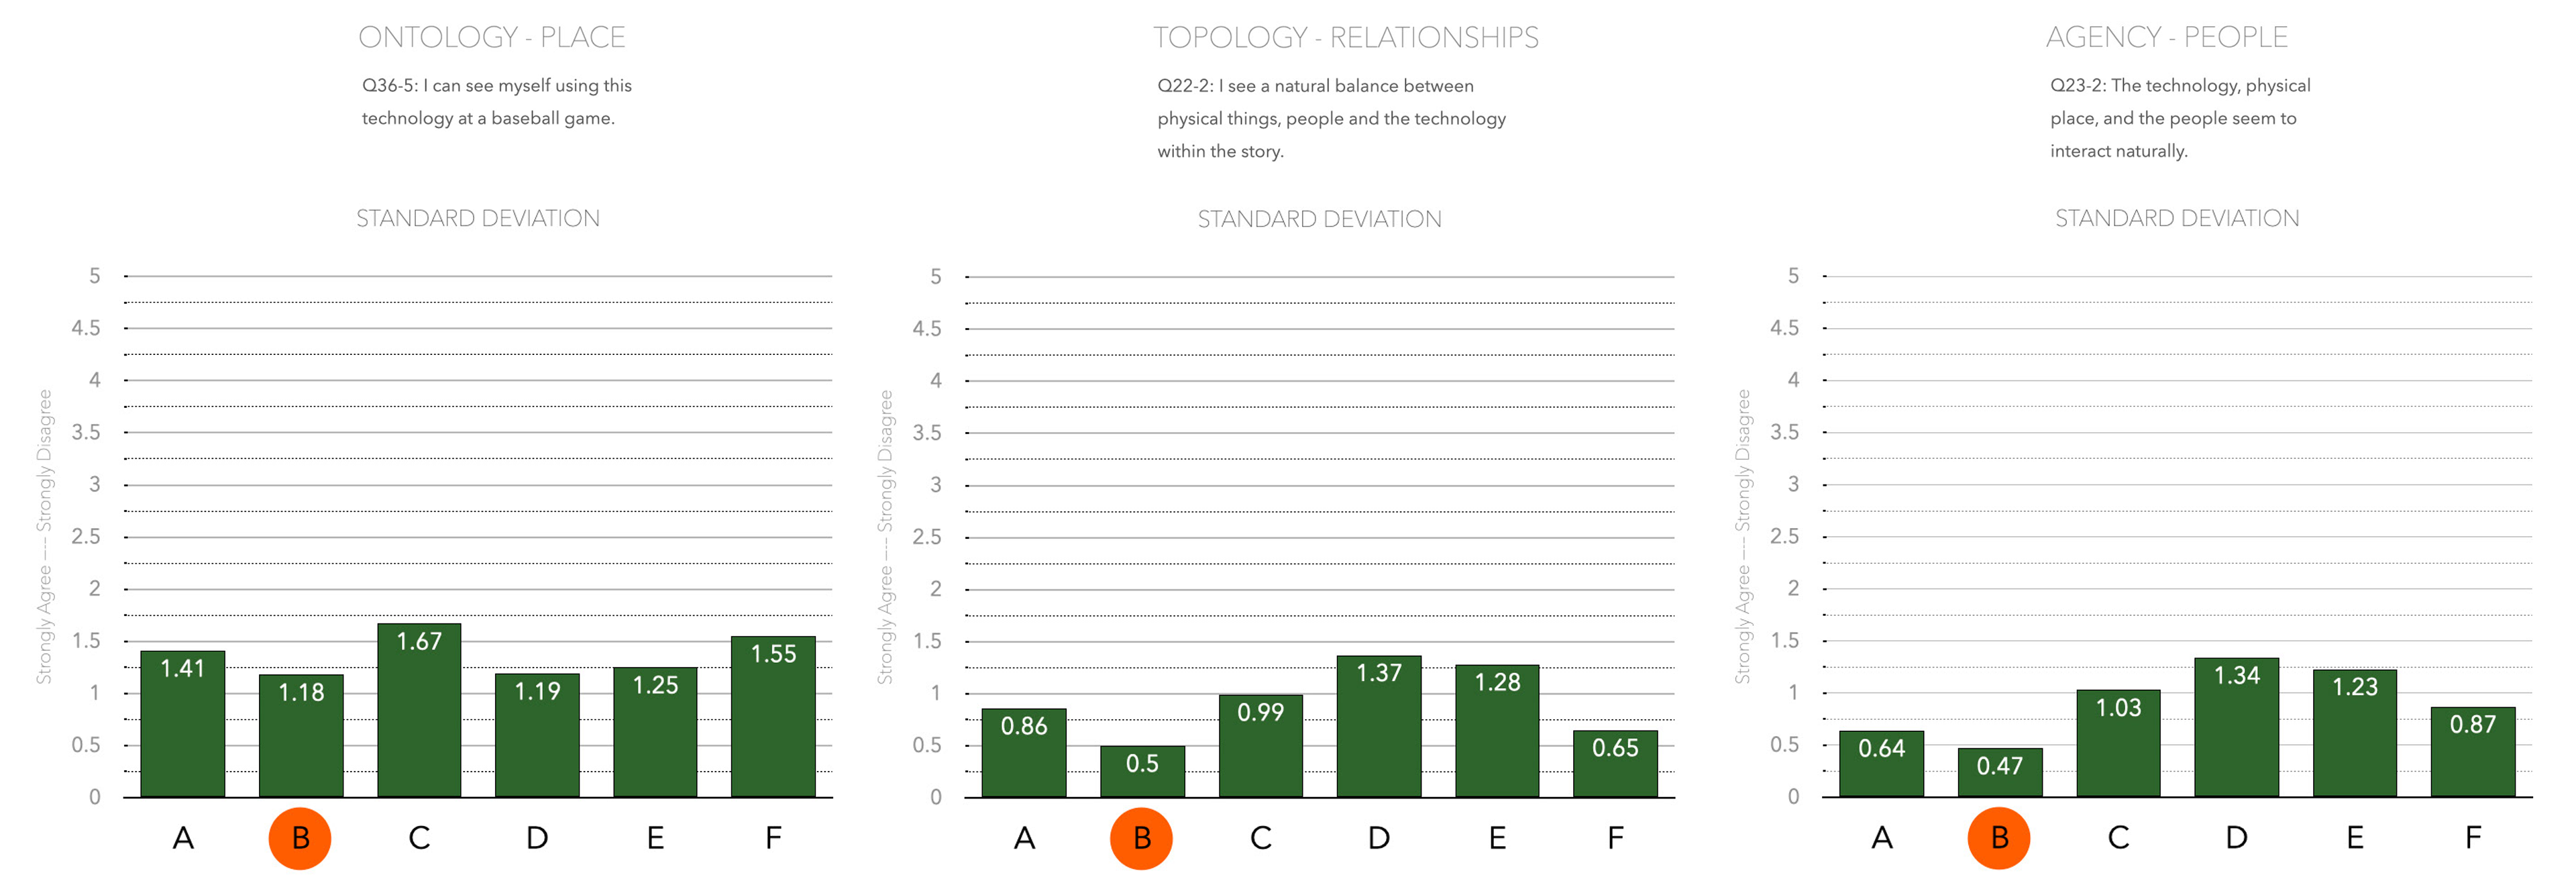
Evaluation Comparisons
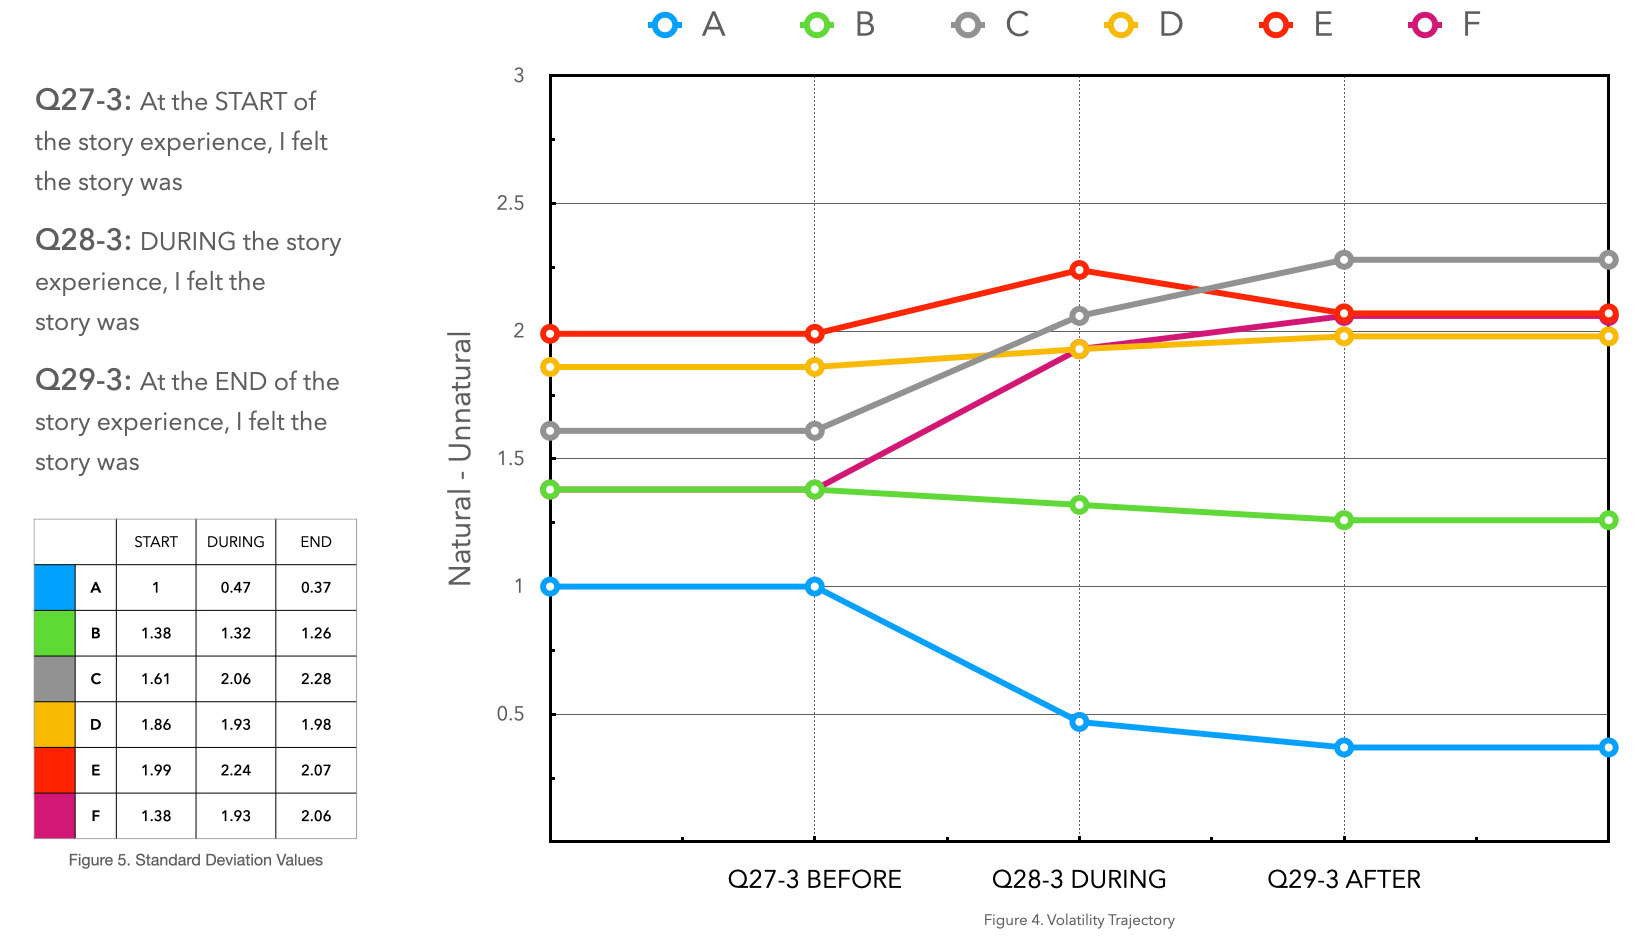
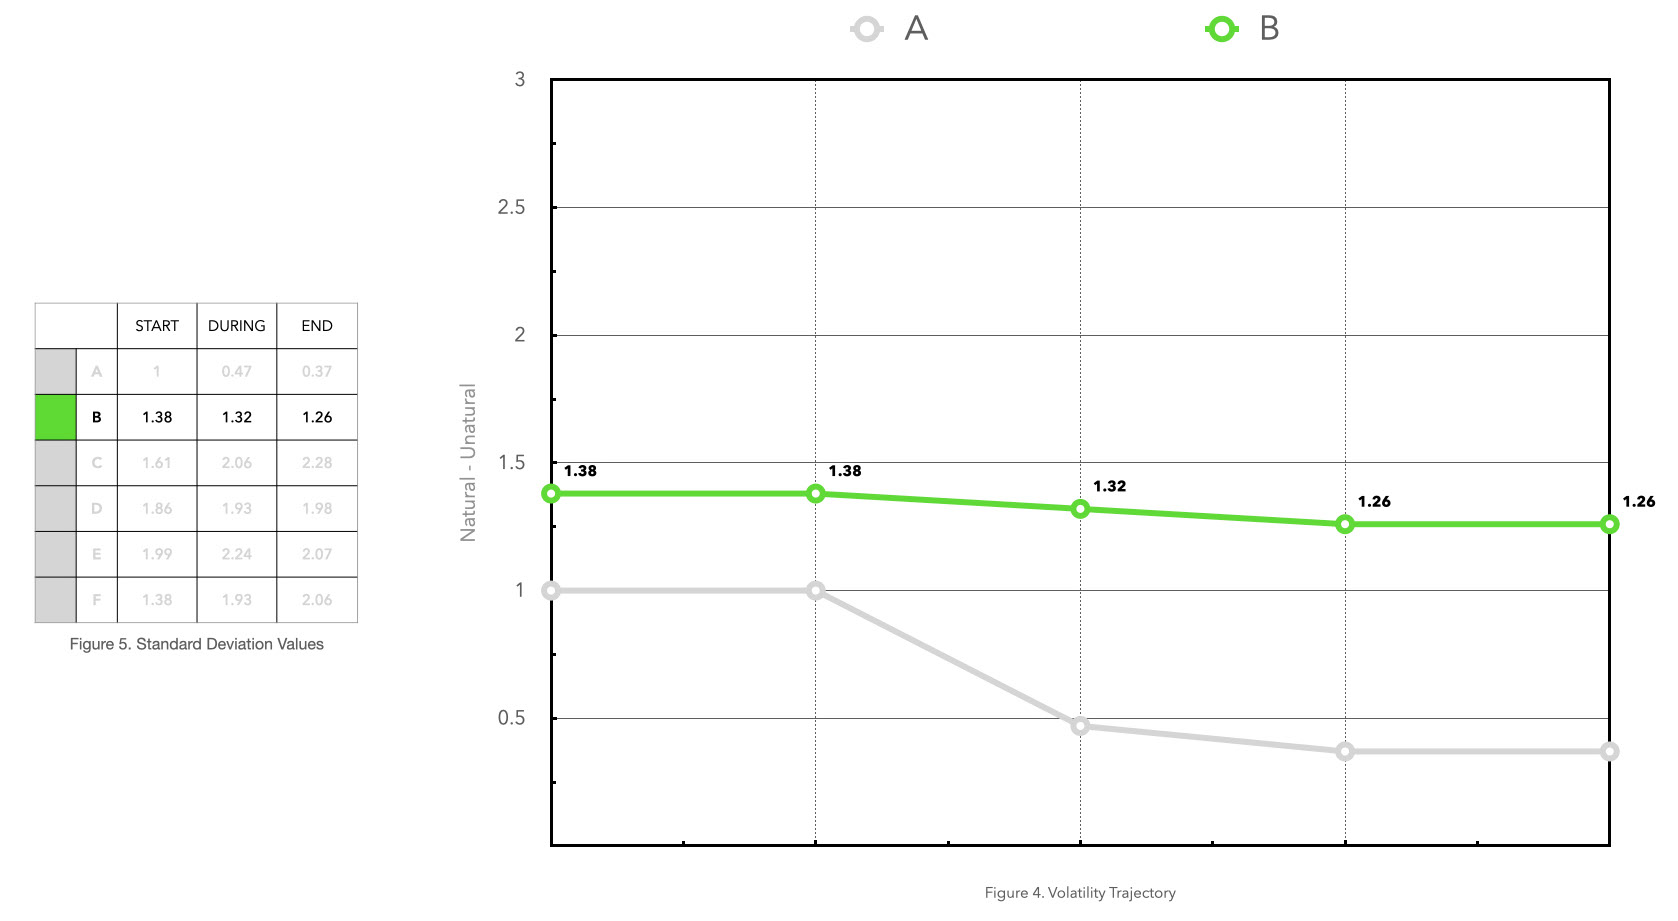
Consistently natural
Further comparisons were made between my storyboard and my peers' based on the data collected in the evaluation. Below shows graphs comparing how natural the storyboards and products are. Based on my evaluation, my storyboard (B) was consistently natural through the sequence of events and how the characters interacted with the product.

UI Sketches
Illustrated Through the Storyboard
After developing my storyboard, I began the process of developing a prototype of the app used to interact with the data-tracking baseball and bracelets. Here are a few UI sketches that were in my storyboard.
Interaction Models
Before, in, and post game
After sketching a few UI screens, I began to develop interaction models. Below shows interaction models for when the user starts a game and when they want to see data in an ongoing game and after a game.

UI Comps
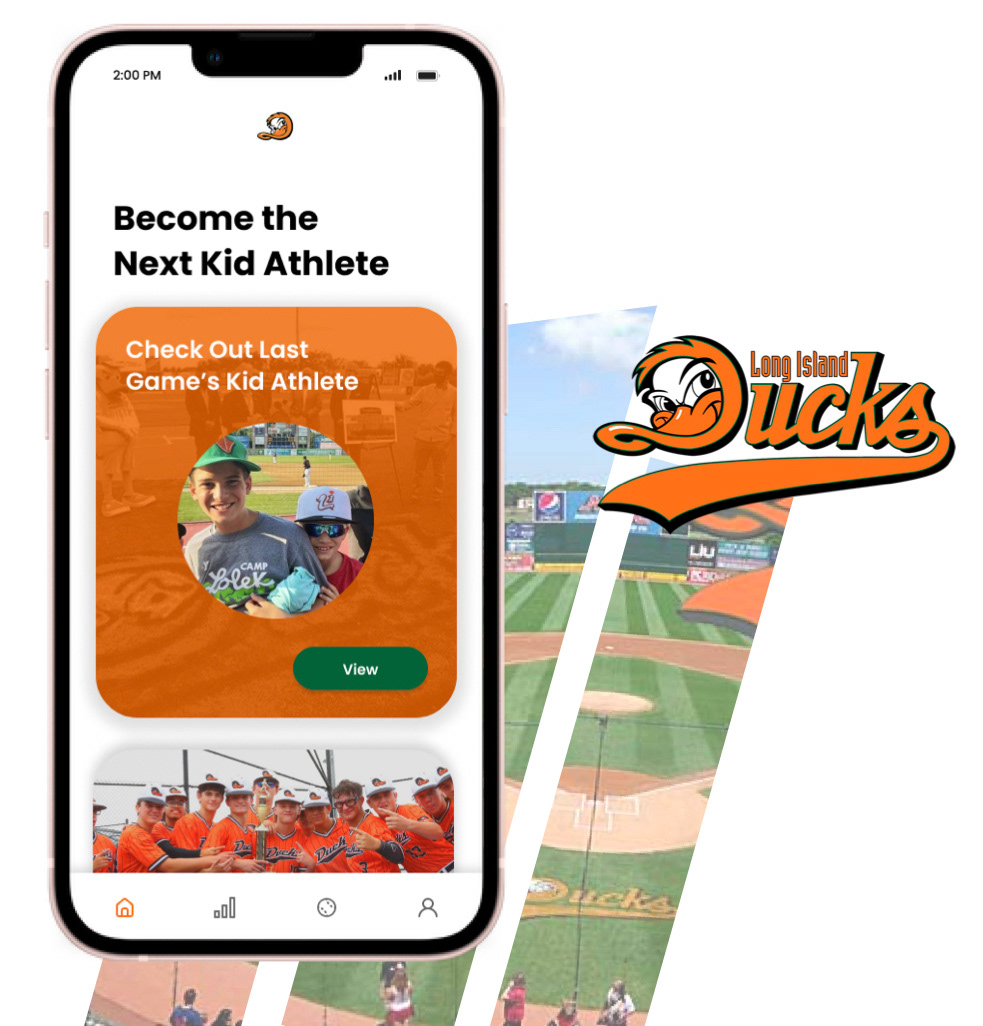
Easy for kids
While following the interaction models, I created UI comps through Figma. While designing the UI, I wanted to keep the theme of the LI Ducks while making it easy to use for kids by looking at other pre-existing sport apps.
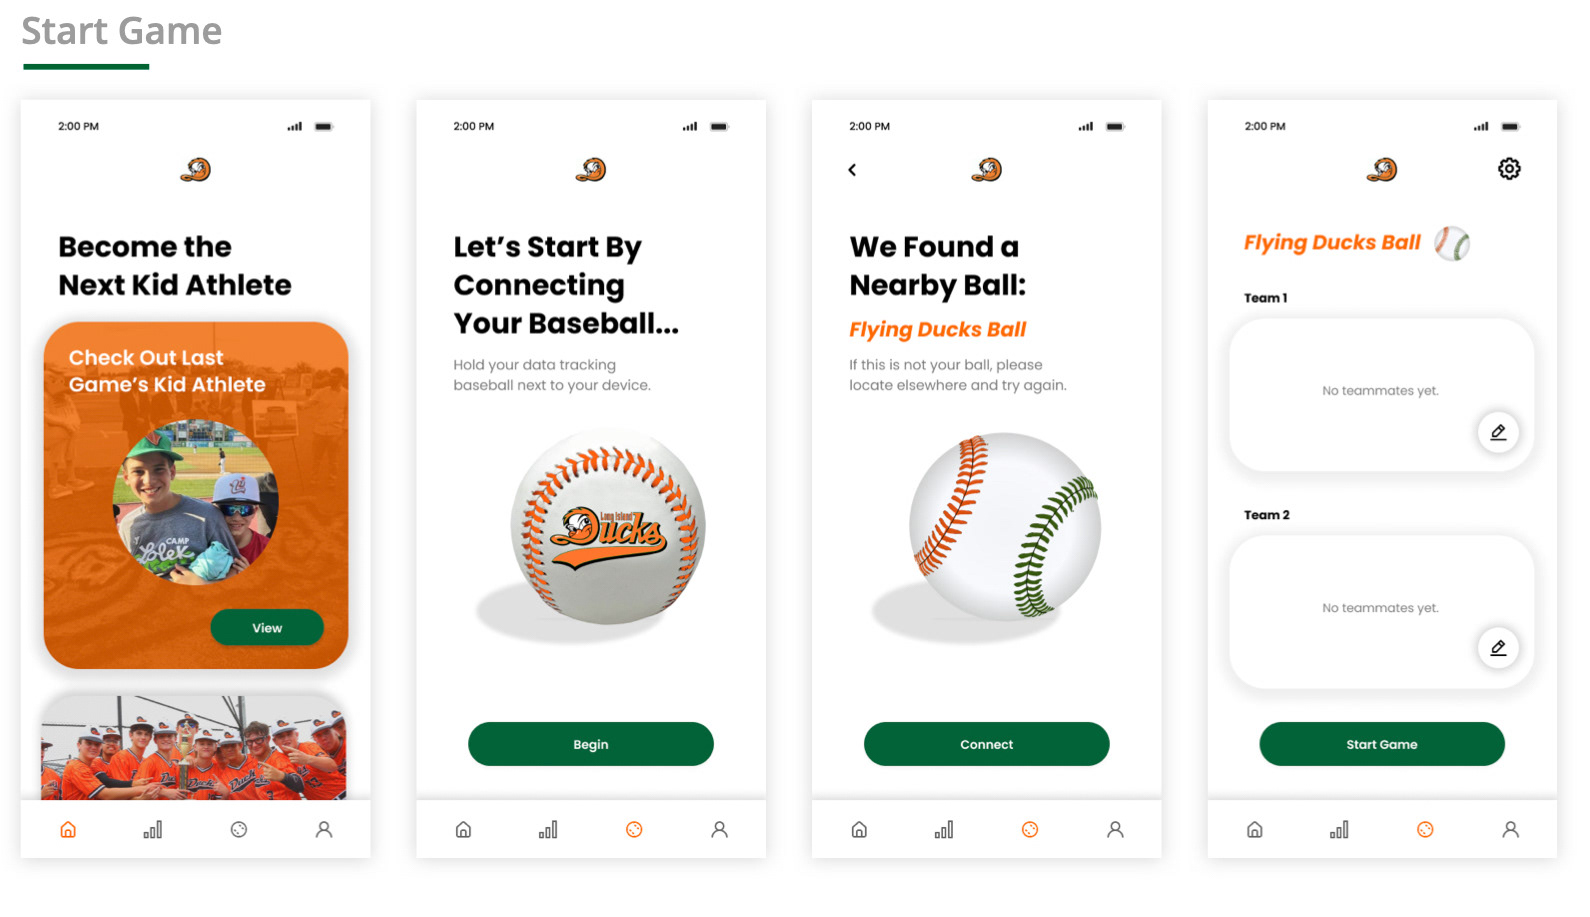

Features of the App
Bracelets, live stats, and Quaker Jack
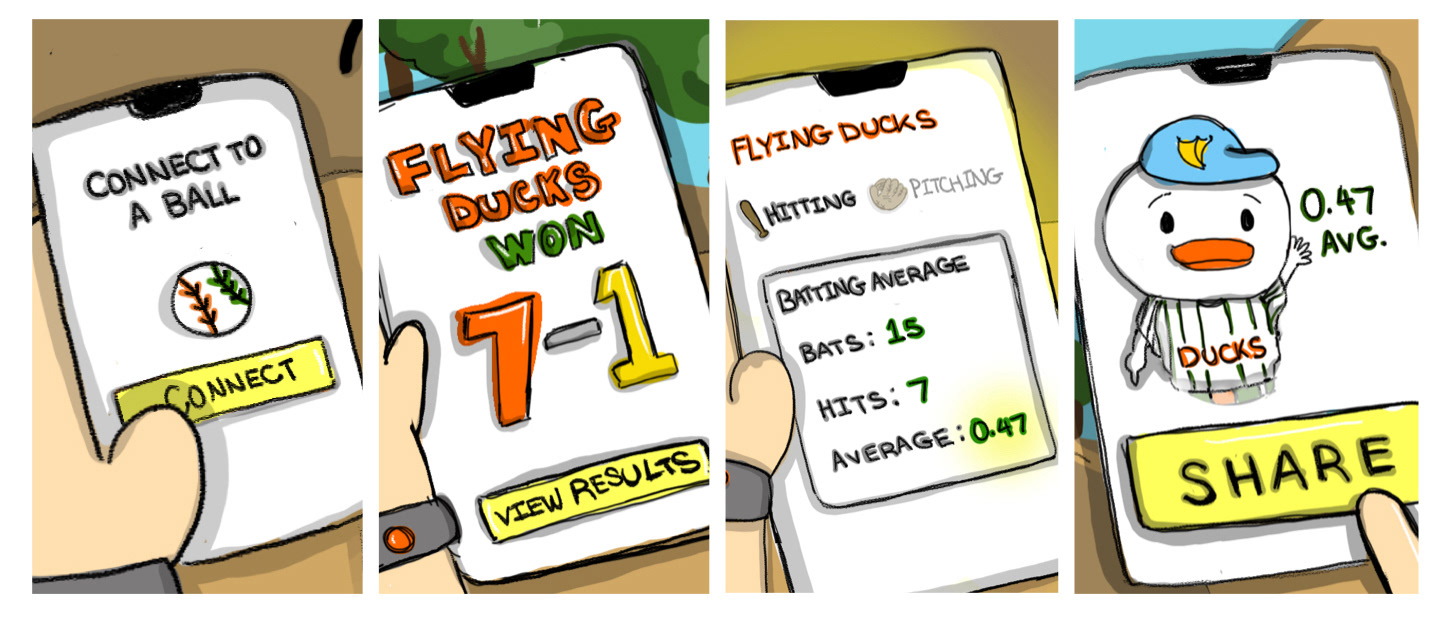
Here displays the UI comps of how users would start a game with the data-tracking baseball by pairing it with the app. Users would then divide themselves into teams by pairing their digital bracelets. When users begin playing a game, they can view live stats. After playing the game, users can share their highlights and achievements to Quaker Jack through the app.

Final Product
Interactive prototype on Figma
As the class semester ends, my final product included a case study of the project, a complete storyboard, and an interactive prototype on Figma. My case study served as an illustrative example for upcoming students in the course and for my professor's future presentations on designing blended experiences.
Reflection and Future Work
Illustration's impact on design thinking
This project impacted my design thinking as it allowed me to further study the interaction of a user and product between the physical and digital space. This project allowed me to fully understand and importance of interactions between people, relationships, and places. As someone who wished to showcase their illustration skills more in case studies, this project was the perfect opportunity for me to do so. With a case study that heavily focused on creating a storyboard, it allowed me to see the impact of story telling and how it can determine how a person would interact with a product. Given more time, I would have delved further into creating visually appealing UI and conducting more user testing. Additionally, it would have been a fascinating idea to develop physical prototypes for the bracelet and bat.